
Customers
CRM Dashboard & Reporting
Support Guide
-
Overview
This guide is intended to assist you with setting up and managing your CRM Dashboard, as well as advise you of useful CRM reporting options that are available within Striven.
Read this guide if you are trying to:
✔ Manage your CRM Dashboard settings.
✔ Select CRM Dashboard widgets that display relevant financial information.
✔ Run reports that will assist you with Opportunity and Sales Reporting.
-
CRM Dashboard
The CRM Dashboard is an all-in-one stop to have a visual representation of your Customers’ data on one page. An overview of Opportunities, Invoices, Referral Sources, and more are all available to gain insight right from the Dashboard without having to navigate and search for more data. Customize your CRM Dashboard to show what is most important to you and your job. Duplicate widgets may be added as well that can be configured to display exactly what information you are looking for based on predetermined criteria.
-
Available Widgets
Once viewing your CRM Dashboard, click Manage Widgets to add or remove widgets as needed.
To view the CRM Dashboard, use the following steps below:
Customers → Dashboard
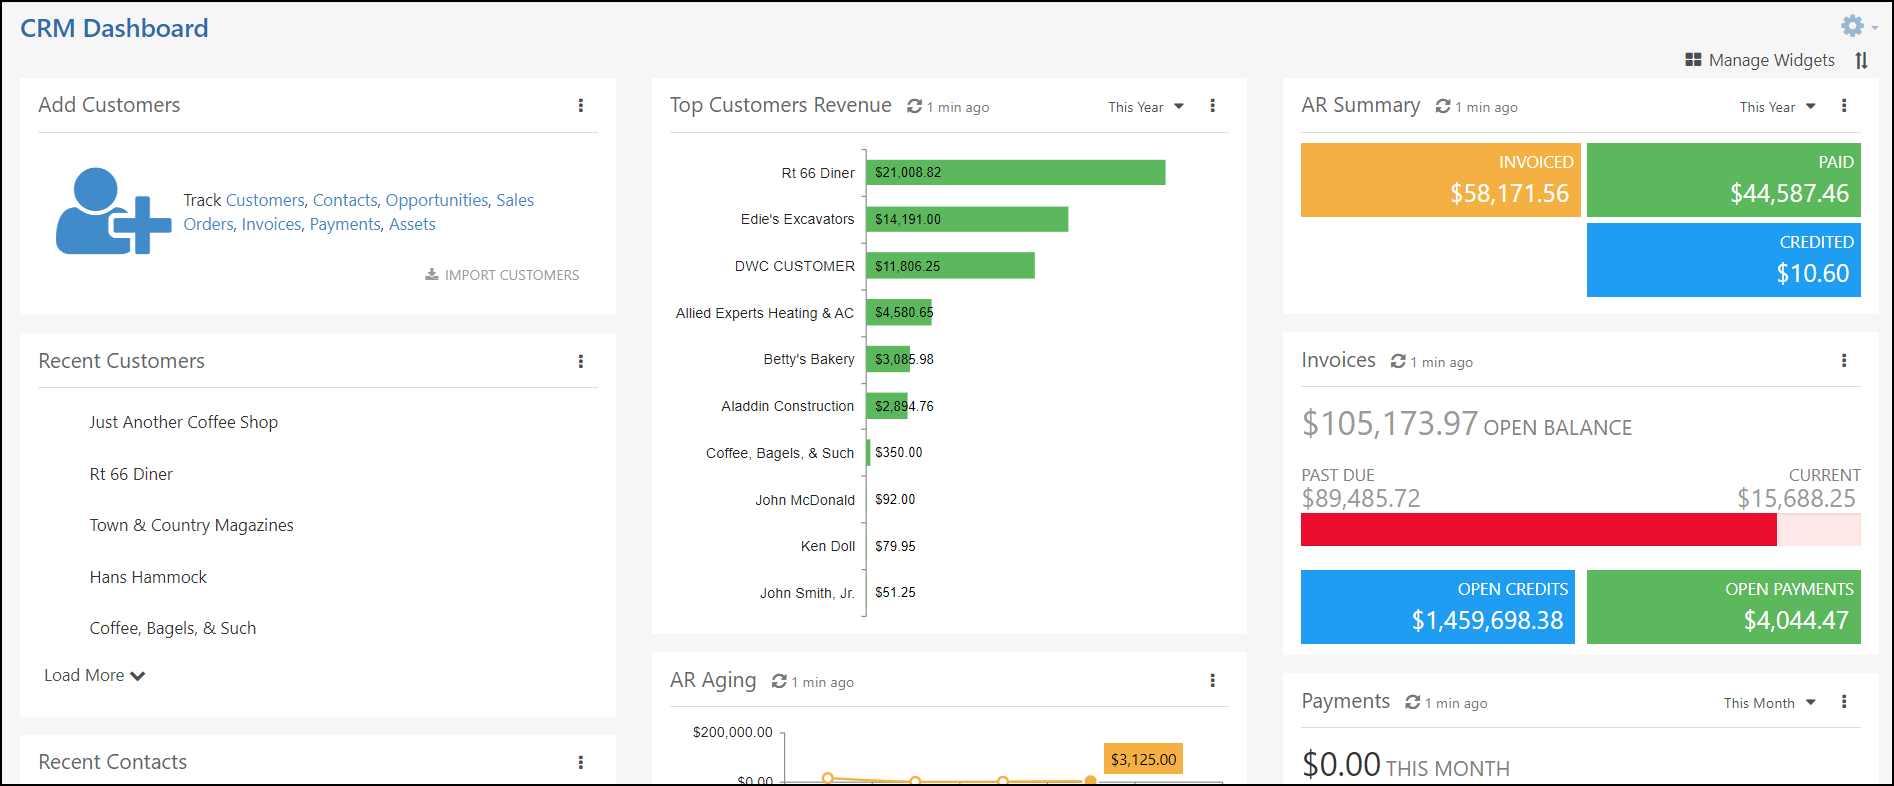
Example of a CRM Dashboard

The following widgets are available to include on your CRM Dashboard within Striven:
- A/R Aging: Displays a graphical view of how much is owed to your Company by Customers along with how late these Payments are. Additional settings include the ability to filter for specific Customers to adjust the report accordingly. A quick link to the A/R Aging Report is also included within the A/R Aging Widget.
- A/R Summary: Displays within the Invoiced box a total dollar amount for Invoices, Sales Receipts, and Journal Entries debiting Accounts Receivables. The Paid box includes a total dollar amount of Payments and Sales Receipts. The Credited box includes a total dollar amount for Credit Memos, Sales Receipts, and Journal Entries crediting Accounts Receivables. A filter is available to change the date range you would like to report on for the A/R Summary. Additional settings include filtering based on Customers in order to see the A/R Summary of a particular list of Customers as needed.
- Invoices: Displays visually what balance is past due compared to what balance is current. A sum of open Credits and open Payments will also be displayed within the widget. Additional settings for this widget allow you to filter for Customers in order to view the Invoice Summary for a particular list of Customers as needed.
- Top Customer Revenue: Allows you to see which of your Customers have contributed to your revenue the most. A drop down is available to select a date period in order to adjust the report accordingly.
- Add Customer: Allows you to quickly access the link to add a new Customer, Contact, Opportunity, Sales Order, Invoice, Payment, or Asset right from your Dashboard without having to navigate away from the page. A quick link to import Customers is available from this widget as well.
- Opportunities: Allows you to see at a glance how many Opportunities you have in each status. A filter is available to narrow down which statuses you would like displayed in the widget. You can also determine if you would like to include in this widget all Opportunities, ones that are assigned to you, or by selecting a specific Employee.
- Recent Contacts: Lists the Contacts that you have most recently viewed. By hovering over a Contact in this list a few actions can be taken:
- Pin the Contact so they will always be listed within this widget at the top of the list.
- Remove the Contact if you do not wish for them to remain within the recent Contacts widget.
- A quick link to see who has viewed the Contact, the direct link to share, and more quick links are available by hovering over the Contact’s name.
- Recent Customers: Lists the Customers that you have most recently viewed. By hovering over a Customer’s name in this list a few actions can be taken:
- Pin the Customer so they will always have that Account at the top of the recent widget.
- Remove the Customer if you do not wish for them to remain within the recent Customers widget.
- A quick link to see who has viewed the Account, the direct link to share, and more quick links are available by hovering over the Customer’s name.
- Referral Sources: Displays how many Customers and Prospects have been entered into your system, separated out based on what referral source is set at the Customer level. A drop-down menu is available to adjust the date period range you wish to have displayed in the chart.
-
Item Profitability Report
The Item Profitability Report is a useful report that calculates how well an Item is selling along with the cost associated. Information such as the average price of an Item, percent of sales an Item is making up, average cost of an Item, along with the profit and profit percent. A sorting option is available to easily sort by information such as the Item, profit percent, quantity, amount, and cost. Clicking into any columns of the report will bring you to a detailed version to gain more insight as to what is making up the total on the report.
To access the Item Profitability Report navigate to Reports → Sales → Item Profitability.
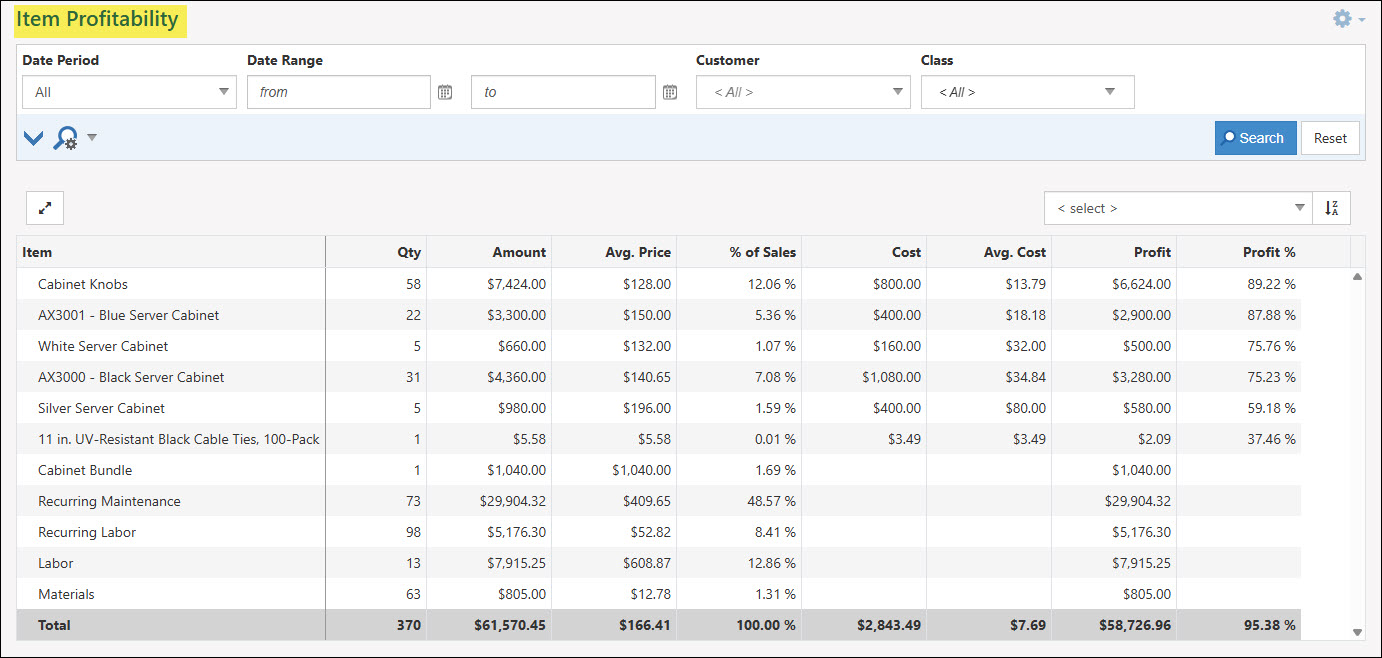
Example of the Item Profitability Report
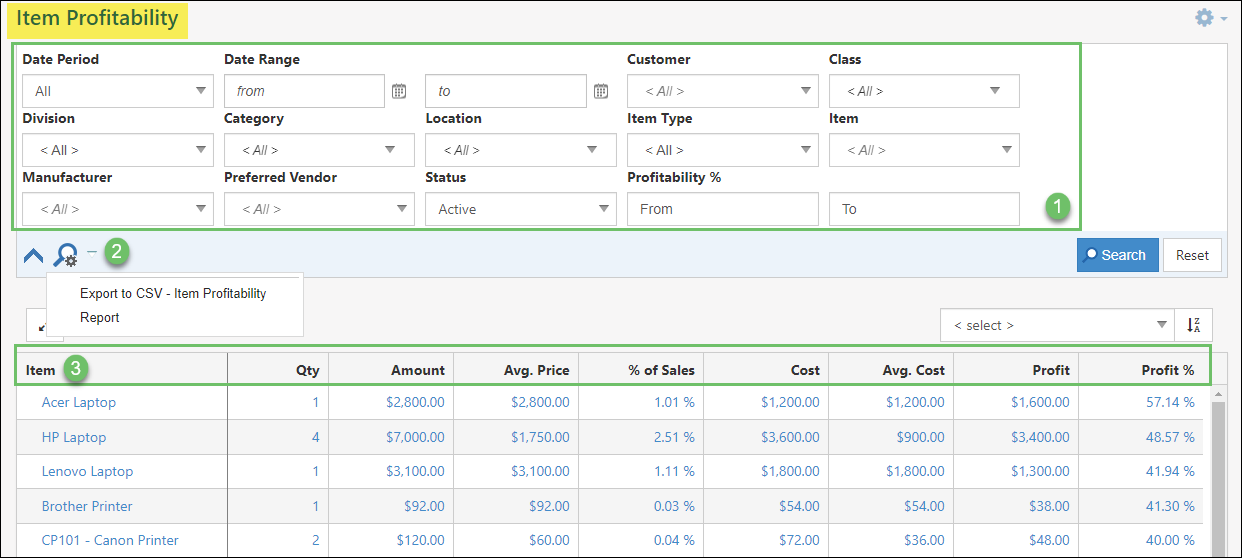
Below is a screenshot illustrating how the Item Profitability Report appears and a description of what can be accomplished there.
- Search Filters: Displays the filters available for use to narrow down the results displayed in the Item Profitability Report.
- Export to CSV: Allows you to export the Item Profitability Report as a .CSV file.
- Report Details: Column headers describing the details shown in the columns of the report.
Example of the Information Available on the Item Profitability Report
-
Sales Order Status Report
The Sales Order Status Report is a great way to view the status of selected Sales Orders along with totals for the amounts invoiced, credited but not yet invoiced, along with days before or after the Target Date and days past the Sales Order approval. A yellow or red label will appear to the left of the Invoice if the Sales Order is associated with an open or past due Invoice.
To utilize the Sales Order Status Report, please use the following steps:
Reports → Sales → Sales Order Status
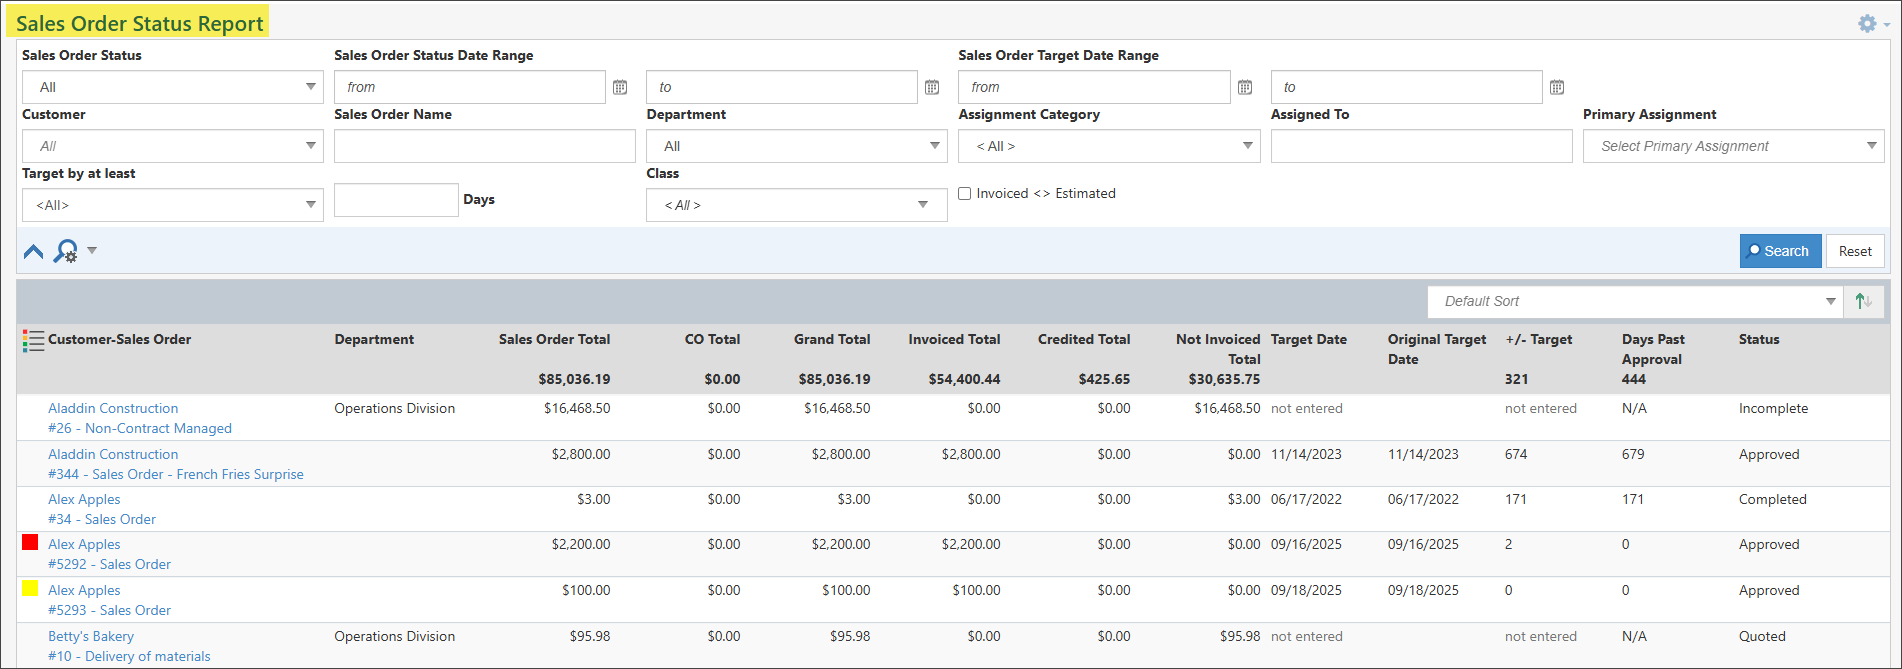
Example of Sales Order Status Report
-
Sales Order Profitability
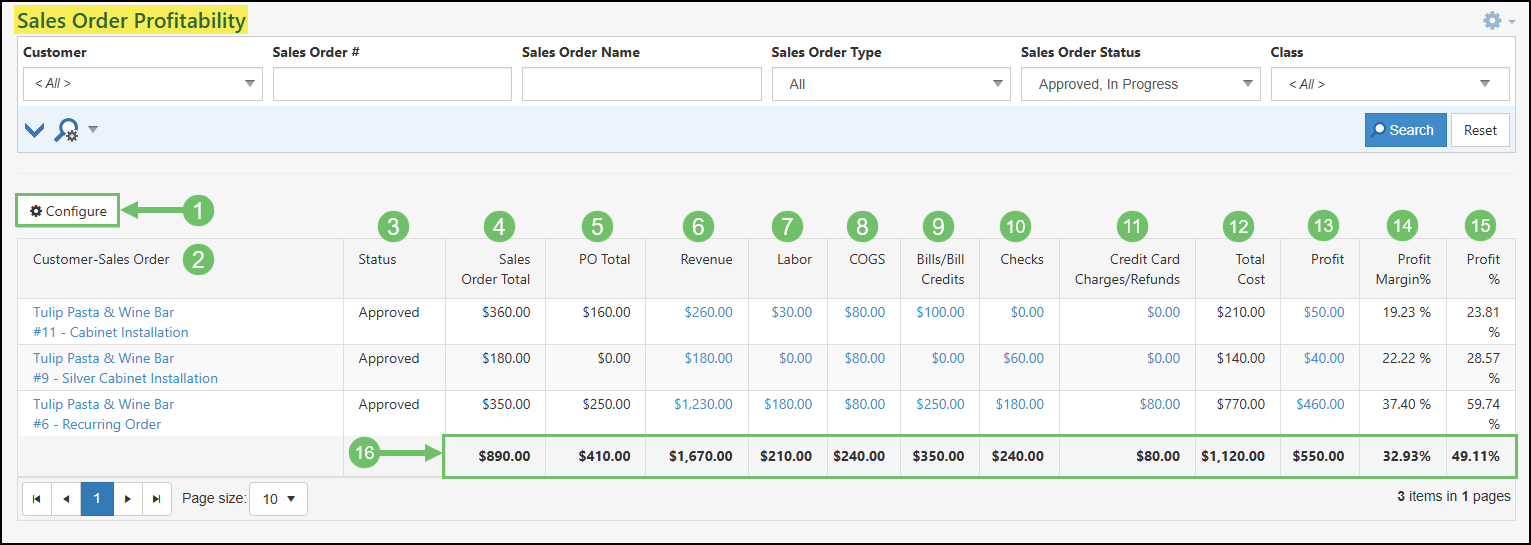
The Sales Order Profitability Report provides a clear view of the profitability of individual Sales Orders, including key metrics like profit, profit percentage, and profit margin. Quick links to Sales Orders and Customers streamline access to related information. Drill-down links for revenue and expense totals provide deeper insights into the underlying data. Review the information below to learn more about what information is available with the Sales Order Profitability report.
To utilize the Sales Order Profitability Report, please use the following steps:
Reports → Sales→ Sales Order Profitability
- Configure: Allows for the user to specify certain types of expenses they would like included in the Sales Order Profitability Report. See the section below for more details on options available with the Configure button.
- Customer-Sales Order: Lists the name of the Customer and the Sales Order. Clicking on either will bring you to the Customer Info or the Sales Order Info page.
- Status: Indicates the status of the Sales Order. When first accessing the Sales Order Profitability Report, the Status filter for the Report will be set to Approved and In Progress. This can be changed by using the search filters located at the top of the report.
- Sales Order Total: Lists the total amount on the Sales Order. Change Orders that have been created from Sales Orders will appear as a separate line in this report.
- PO Total: Sums the total amount of all Purchase Orders that are related to the Sales Order.
- Revenue: Sums the total amount for Invoices, Sales Receipts, and Credit Memos that are related to the Sales Order. To see the list of Invoices, Sales Receipts, and Credit Memos that make up this total, click on the number listed under the Revenue column for a specific Sales Order.
- Labor: Sums the total for approved Time Entries that have been related to the Sales Order. Clicking on the link here will open the Timesheet Report which will be pre-filtered based on the Sales Order.
- Note: If you have specific Items filtered for Labor with the Configure option from the Sales Order Profitability Report, those Items will be pre-filtered when accessing the Timesheet Report.
- COGS: Relates to the Cost of Goods related to Inventory Items on the related Invoices, Sales Receipts, or Credit Memos. Clicking on the total amount here will open the Sales Order Profitability – COGS Details page for more details.
- Bills/Bill Credits: Sums the total amount for Bills and Bill Credits that are related to the Sales Order. To see a detailed list, click on the number listed under this column for a specific Sales Order.
- Checks: The total amount from all checks linked to the Sales Order is displayed here. To see a detailed list, click on the number listed under this column for a specific Sales Order.
- Credit Card Charges/Refunds: Sums the total amount for Credit Card Charges and Credit Card Refunds that are related to the Sales Order. To see a detailed list, click on the number listed under this column for a specific Sales Order.
- Total Cost: Displays a sum total for the Labor, COGS, Bills/Bill Credits, Checks, and Credit Card Charges/Refunds columns.
- Profit: Calculates the Revenue column minus the Total Cost column for a Profit amount. Clicking on the number listed in the Profit column will open the Sales Order Profitability Statement which will be explained in the Sales Order Profitability Statement section below.
- Profit Margin %: Calculates the Profit column divided by the Revenue column. This column will display as a percentage.
- Profit %: Calculates the Profit column divided by the Total Cost column. This column will display as a percentage.
- Totals: Displays an overall total for each column listed in the report.
Example of the Sales Order Profitability Report
-
Configure Report
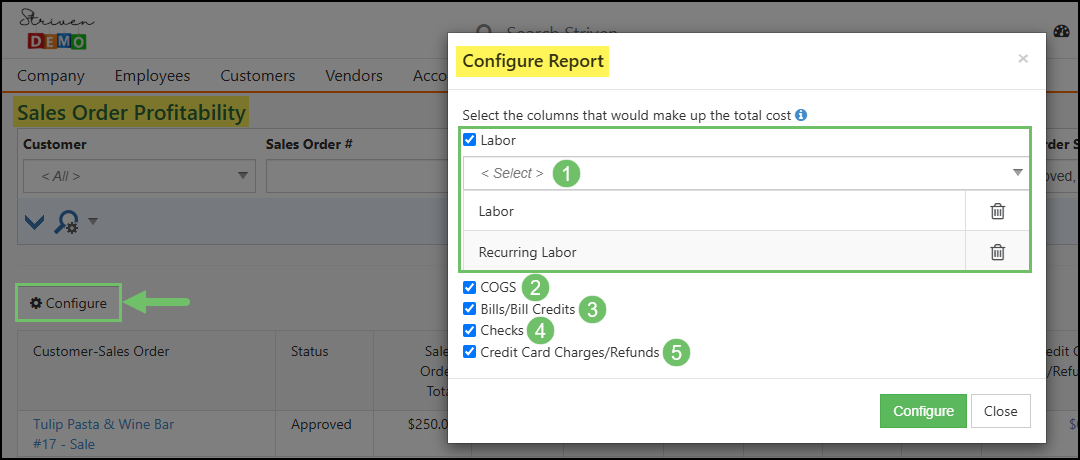
As mentioned above, clicking the Configure button located at the top of the Sales Order Profitability Report will allow the user to narrow down what type of expenses should be included in the calculations of the report. Review below which expenses can be toggled on or off when reporting on the profitability of an order.
- Labor: Calculates the total of approved Timesheets related to the Sales Order. When checked on, an additional filter is available to select which specific Items that should be included from the related Timesheets. Toggling this option off will remove the Labor column from the report.
- COGS: Calculates the total GL Postings related to COGS from any active Invoices, Sales Receipts, or Credit Memos without including any related Taxes. Toggling this off will remove the COGS column from the report.
- Bills/Bill Credits: Toggling this option off will remove the Bills/Bill Credits column from the report and will not calculate any Bills or Bill Credits into the profit of a Sales Order.
- Checks: To remove the Checks column from the report and not have any Checks included into the calculation of a Sales Order’s profit toggle this option off.
- Credit Card Charges/Refunds: To remove the Credit Card Charges/Refunds column from the report and not have these included into the calculation of a Sales Order’s profit, toggle this option off.
Example of the Configure Option in the Sales Order Profitability Report
-
Sales Order Profitability Statement
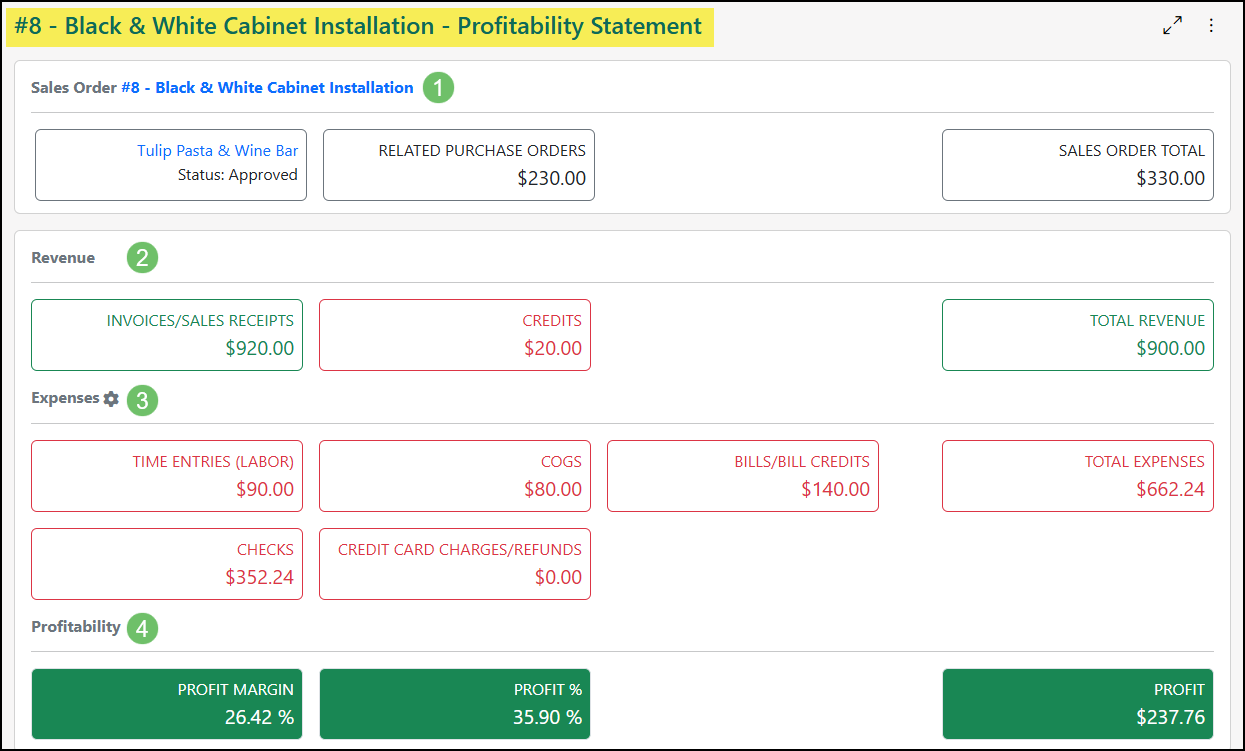
Access the Sales Order Profitability Statement by clicking on the number listed in the Profit column when viewing the Sales Order Profitability Report. This page will display profitability information such as the Revenue, Expenses, with a calculated Profitability. A detailed list of Transactions related to the Sales Order is shown with an option to Group By Item. Review the information included within this report below:
- Sales Order: Shows details such as the Order Number and Name which is hyperlinked, Customer which is hyperlinked, status of the Sales Order, total amount in Related Purchase Orders, and the Sales Order Total.
- Revenue: Displays total amount in Invoices and Sales Receipts along with total in Credits. A Total Revenue field is calculated by subtracting the Credits from the related Invoices and Sales Receipts.
- Expenses: Lists out total Time Entries, COGS, Bills or Bill Credits, Checks, and Credit Card Charges or Refunds related to the Sales Order. A Total Expense field is determined by adding all expenses together. Remove types from being included in the Total Expense calculation by clicking the gear icon. By clicking the gear Icon, Labor can be narrowed down to specific Items.
- Profitability: Measures how well a Sales Order is doing by subtracting the Total Expenses from the Total Revenue and displaying the Profit, Profit %, and Profit Margin.
Example of the Sales Order Profitability Statement
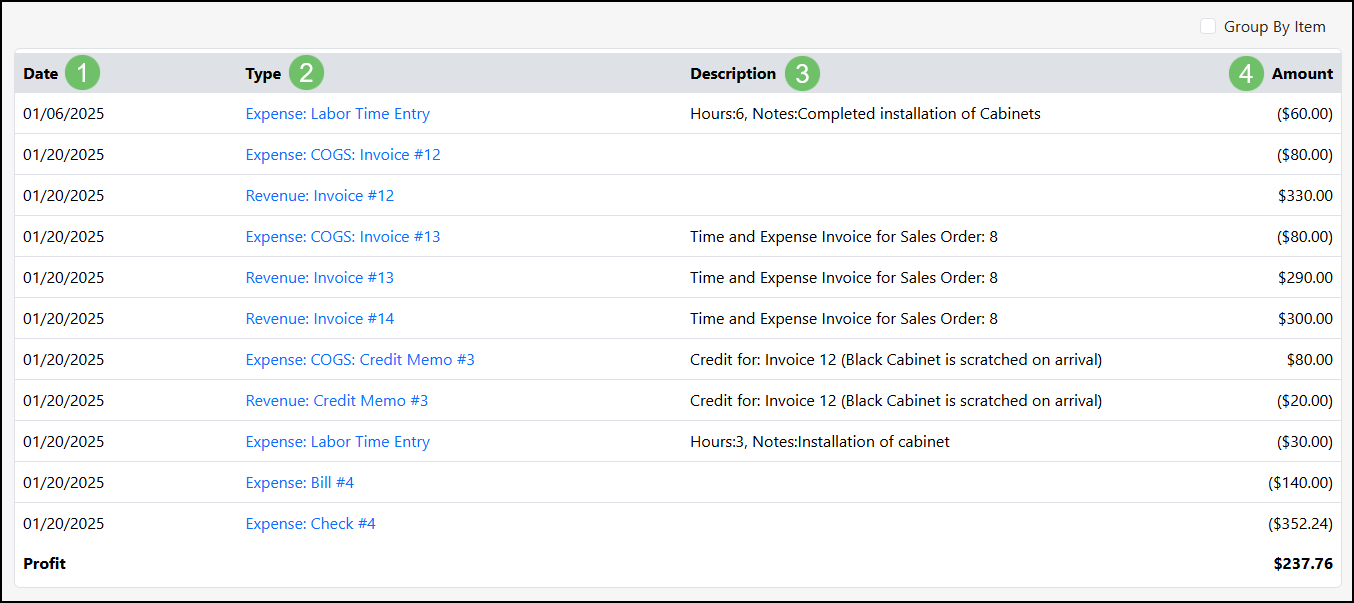
There are two views available for the details of the Sales Order Profitability Statement. By default, the report will show a list of Transactions related to the Sales Order with an additional option to Group By Item.
The Transactions List view will include the following information:
- Date: Lists the calendar date that has been set on the related Transaction.
- Type: Lists the related Transaction to the Sales Order. The hyperlinked Transaction will be led with either Expense or Revenue to indicate how it is being calculated within the profitability of the Sales Order.
- Description: Includes any notes added to Time Entries or memos entered on the related Transaction.
- Amount: Total for the related Transaction. Negative numbers are indicated with (parentheses) around the amount. The bottom of the Amount column will have a total included.
Example of the Transactions View on an Sales Order Profitability Statement
The Group By Item view will include the following information:
- Item: Lists the hyperlinked Item name. If the related Expense has no Item related a line will be included for No Item Specified. This will occur if the related Expense Transaction, such as Bills, Credit Card Charges, or Checks, has an amount entered into the Expenses tab rather than the Items tab.
- Revenue: Totals the Revenue for the Item by calculating the Sales Order’s related Invoices, Sales Receipts, and Credits.
- Expenses: Totals the Expenses for the Item by calculating the Time Entries, COGS, Bills, Bill Credits, Checks, Credit Card Charges, and Credit Card Refunds related to the Sales Order.
- Profit: A hyperlinked total calculating the Revenue minus the Expenses per Item listed. Clicking on the total amount will bring up a detailed list of Transactions which contain the Item.
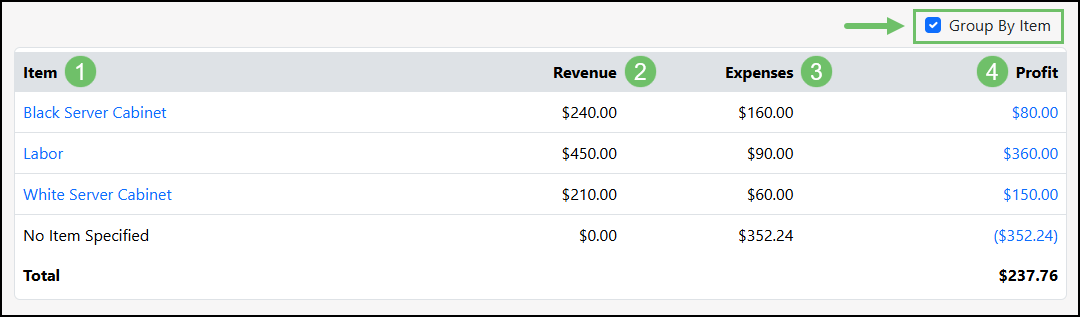
Example of the Group by Item View on an Sales Order Profitability Statement
-
Relating Transactions to Sales Orders
As mentioned above, the Sales Order Profitability is calculated based on Transactions and Timesheets that have been related to the Sales Order. Review below on how to set this relationship to the related Sales Order in order to gain the most insight into the profitability.
Accounts Receivable Transactions
AR Type Transactions that can be related to a Sales Order include Invoices, Sales Receipts, and Credit Memos. When entering these types of Transactions in Striven a Sales Order field is available when filling information into the Transaction. Once a Customer has been selected on the Transaction, the Sales Order field will filter so only the Customer’s orders are available to choose. Sales Orders that have the status of Incomplete, Quoted, Pending Approval, Declined, Approved, In Progress, or Completed will be available to select in this field. Sales Orders that have the Canceled or Lost status will not be available for selection when adding an AR Type Transaction.
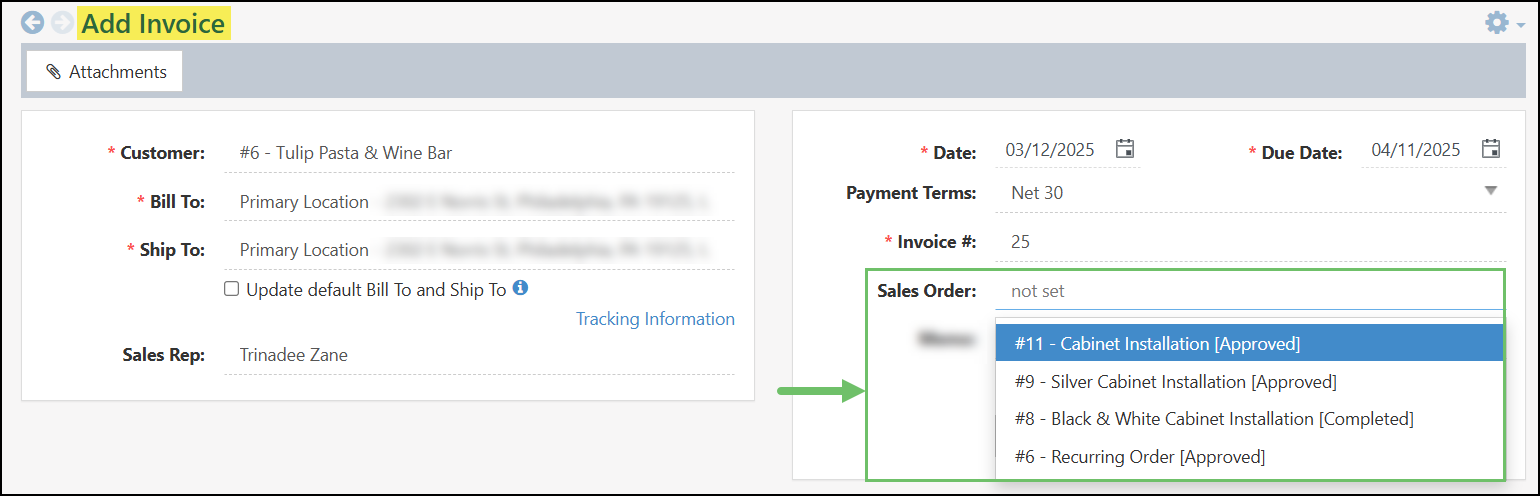
Example of Relating a Sales Order to an Invoice
When creating an Invoice from the Actions Menu in a Sales Order, the Customer and Sales Order fields will auto-fill on the Invoice being created.
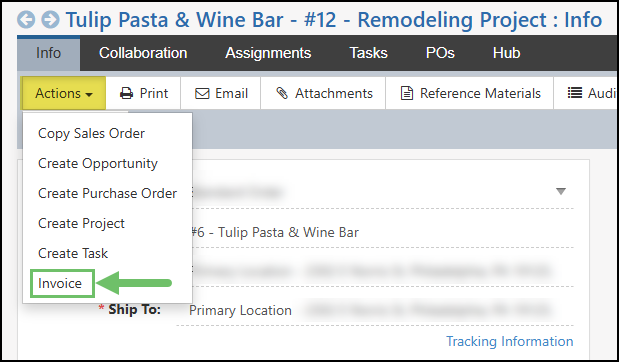
Example of the Invoice Option in the Actions Menu on a Sales Order
Purchase Orders and Accounts Payable Transactions
Sales Orders can be related to Purchase Orders and AP Type Transactions, such as Bills, Bill Credits, Checks, Credit Card Charges, and Credit Card Refunds, through each line Item that is listed within the PO or Transaction. For each line Item, you will first need to select the Customer in the Select Customer field. Once the Customer is selected, a field will appear for Select Sales Order which will list the Customer’s Orders that are in one of the following statuses: Incomplete, Quoted, Pending Approval, Approved, In Progress, Completed. Sales Orders that are in a status of Declined, Canceled, or Lost will not be available to select in this field.
Note: The Select Customer and Select Sales Order fields are available when using both the Expenses and Items tabs when creating an AP Type Transaction.
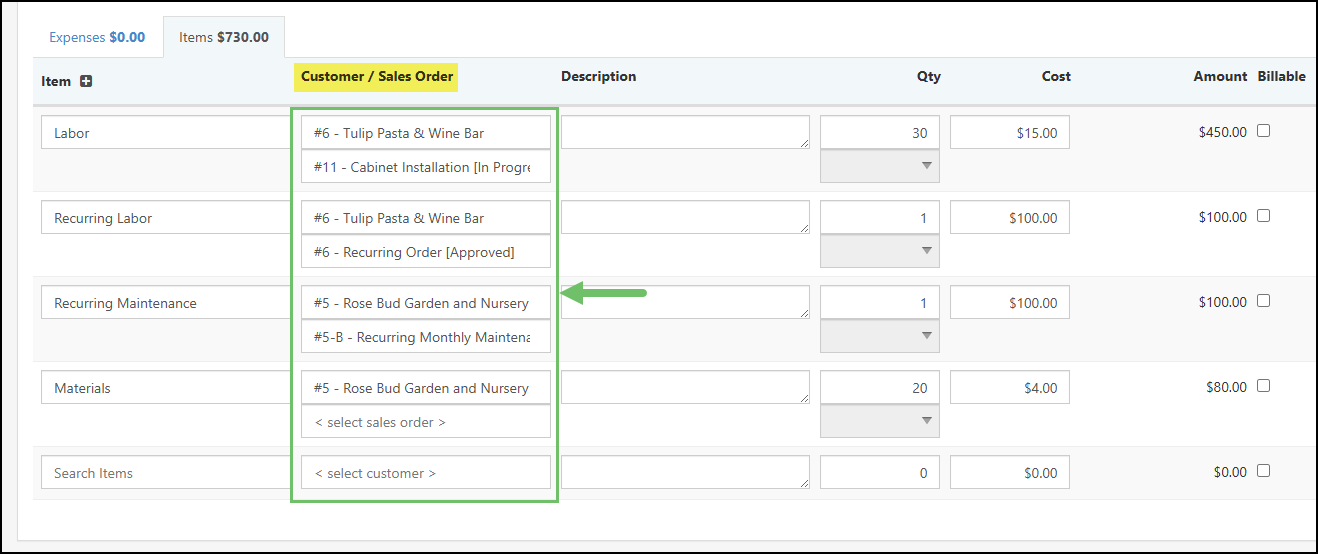
Example of the Customer and Sales Order Column on an AP Type Transaction
When creating a Purchase Order from the Actions Menu in a Sales Order, the Customer and ales Order fields will auto-fill for each line Item that was prepopulated on the Purchase Order.

Example of the Create Purchase Order Option in the Actions Menu on a Sales Order
Timesheets and Time Entries
When entering a Time Entry in Striven, a field for Customer is available in order to relate the time to a specific client. Once a Customer has been selected on the Time Entry, an additional field will appear for the Sales Order. Sales Orders with the status of Incomplete, Quoted, Pending Approval, Approved, In Progress, or Completed will be available to select for Time Entries. A Sales Order is not selectable on a Time Entry if it is set to Declined, Canceled, or Lost.

Example of the Customer and Sales Order Field on the Add Time Entry Page
When using the Timesheets page, Sales Orders can be related to each line entered if the Time Entry Type is set to Sales Order or Task.

Example of the Timesheet Page with Customers and Sales Orders Selected
When using the Add Time button available at the top of a Sales Order, the Customer and Sales Order will pre-fill on the Time Entry that can be created.
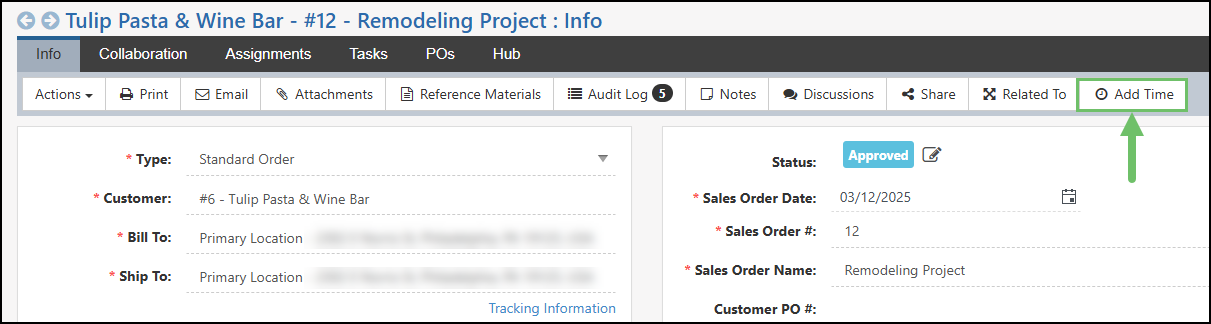
Example of the Add Time Button on a Sales Order
-
Sales Order Fulfillment Report
The Sales Order Fulfillment Report is a useful tool to make sure that everything a Customer has ordered has been purchased, received, and delivered in order to complete Sales Orders efficiently and correctly.
To access the Sales Order Fulfillment Report, navigate to Reports → Sales → Sales Order Fulfillment.
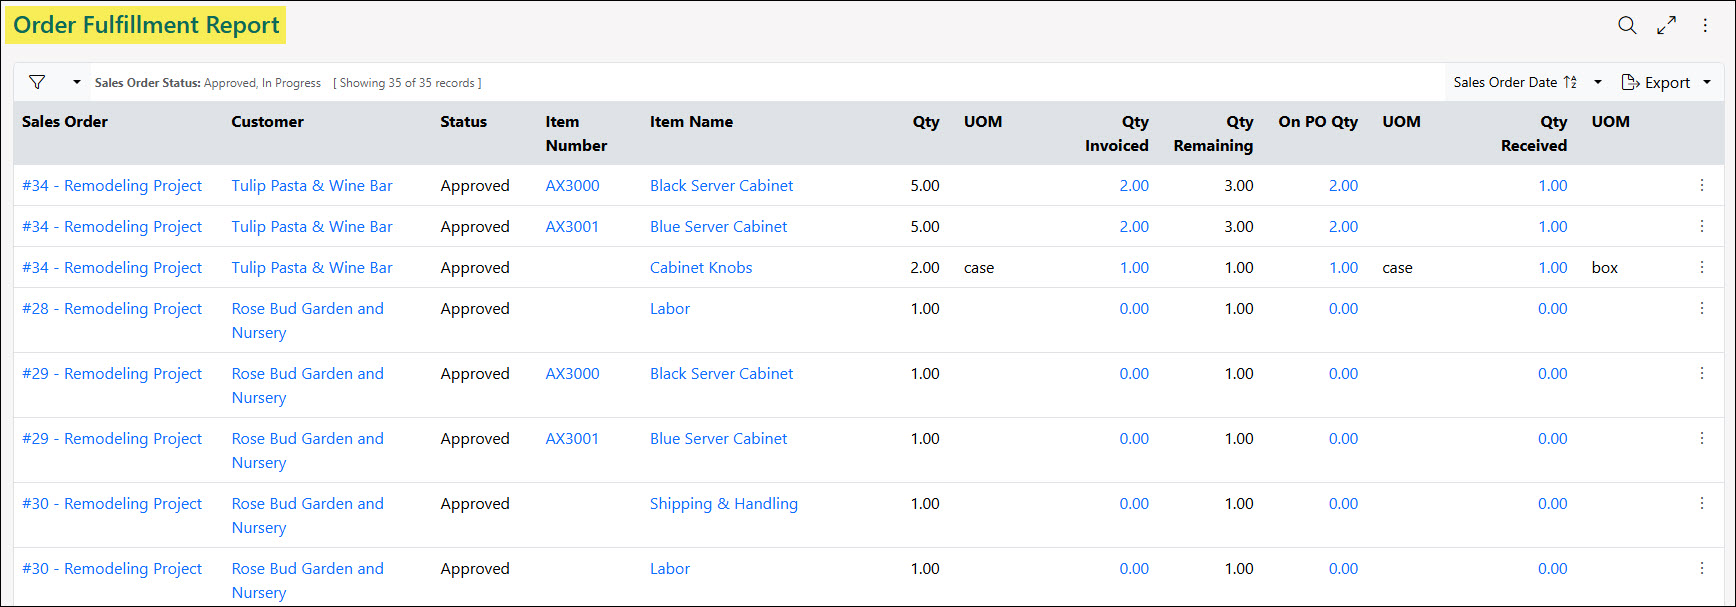
Example of the Sales Order Fulfillment Report
Below is a screenshot illustrating how the Sales Order Fulfillment Report appears and a description of what can be accomplished there.
- Search Filters: There are an array of search filters available to narrow results listed on the Sales Order Fulfillment Report such as:
- Sales Order Type: Filters the report to only include Sales Orders of specific types.
- Sales Order Status: By default, the report will only show Sales Orders that are in an Approved or In Progress status. This search filter can be used to include Sales Orders in other statuses, such as Incomplete, Quoted, Pending Approval, Declined, Canceled, Lost, or Completed.
- Sales Order Date: Allows you to add in a date range to narrow results in the report based on the date entered into the Sales Order Date field on the Sales Order.
- Customer: A single-select option to only include Sales Orders that are associated with a specific Customer.
- Item: Narrows results in the report by a specific Item that has been included on Sales Orders.
- Item Type: Adjusts results in the report to include all Items for specific Item types that have been added on Sales Orders.
- Item Category: Shows results in the report to include all Items that have been assigned specific Categories which have been added to Sales Orders.
- Exclude Fulfilled: Removes any Sales Orders from the report that have already been fulfilled.
- Export: Allows the user to export the report on to their computer or device into an Excel or spreadsheet format.
- Sales Order: Lists the Sales Order number and name. This column will be hyperlinked in order to easily open the related Sales Order. The Order will be repeated in this column based on the amount of Items that were added to the Sales Order.
- Customer: Displays the Customer’s name related to the Sales Order. Clicking on the hyperlink listed in this column will open the Customer’s Dashboard for additional details.
- Status: Shows the current status the Sales Order resides in. By default, the report will only show Sales Orders that are in an Approved or In Progress status but this can be changed using the Sales Order Status search filter available.
- Item Number: Lists the number that has been added to the Number field on the Item Info page for the Item being reported on. Clicking on the hyperlink listed here will open the Item Info page to easily view more details regarding the Item.
- Item Name: Lists the name that has been entered into the Name field on the Item Info page. Clicking on the hyperlink listed in this column will open the Item Info page for additional details about the Item.
- Qty & UOM: Shows the total quantity that was added on the Sales Order for the Item along with a separate column to include the unit of measure.
- Qty Invoiced: Shows the total quantity of the Item that was included on Invoices and Sales Receipts related to the Sales Order. Clicking on the hyperlinked number listed in this column will open a Details version of the report which lists the related Invoices and Sales Receipt.
- Qty Remaining: Calculates how much quantity of the Item from the Sales Order still remains to be Invoiced. This column is calculated as (Qty – Qty Invoiced).
- On PO Qty & UOM: Lists the quantity of the Item has been included on Purchase Orders related to the Sales Order along with the unit of measure in a separate column. Clicking on the hyperlinked number listed here will open a Details version of the report which will list the related Purchase Orders.
- Qty Received & UOM: Lists the quantity of the Item that has been added to a Bill or Received Items related to the Purchase Order along with the unit of measure in a separate column. Clicking on the hyperlinked number listed here will open a Details version of the report to view a list of the Bills and Received Items.
- Vertical Ellipsis: Underneath the vertical ellipsis located for each line item in the report will contain two options:
- Profitability Statement: Navigates to the Sales Order Profitability Statement for the Sales Order listed.
- Inventory Stock Status: Navigates to the Inventory Stock Status report which is prefiltered for the Item listed from the Sales Order Fulfillment Report.
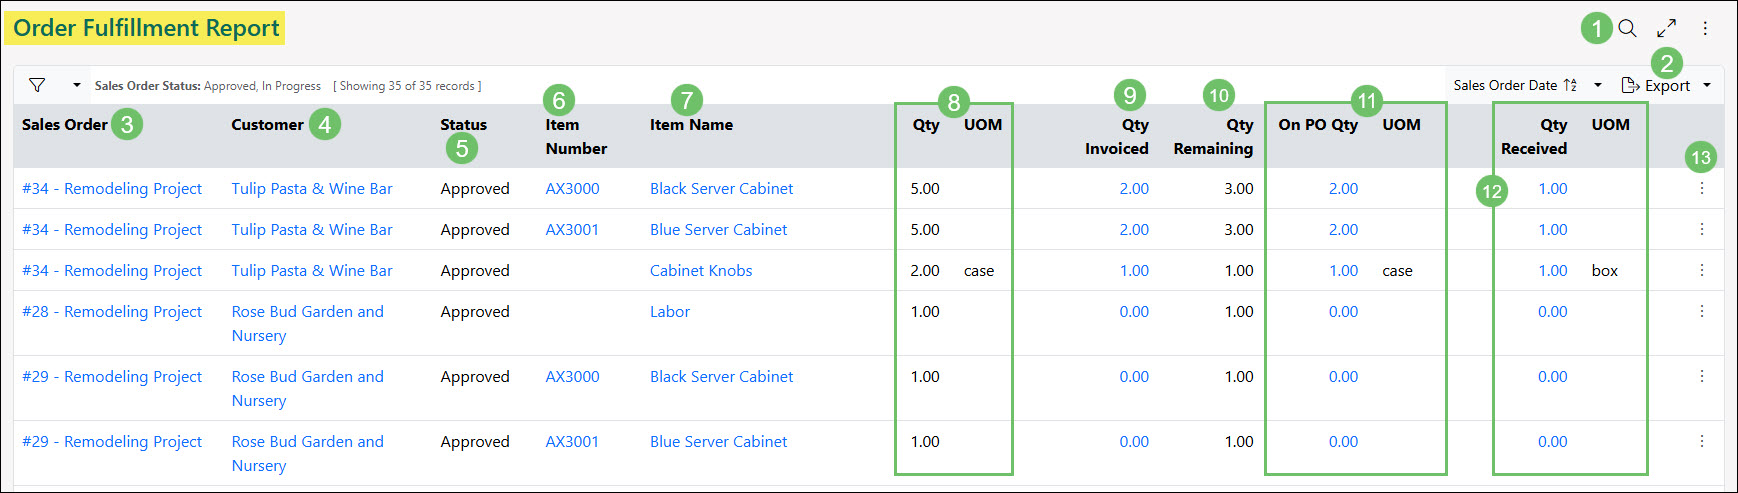
Example of the Information and Actions Available from the Sales Order Fulfillment Report
- Search Filters: There are an array of search filters available to narrow results listed on the Sales Order Fulfillment Report such as:
-
Opportunity Report
The Opportunity Report is a built-in report that allows you to filter data regarding Opportunities and export to different formats. You can easily view which industries and referral sources are leading to your most valuable Customers. The insights gained will give you a better idea of where to budget the marketing dollars for your Company.
You can also gauge how long each Lead was in the system. Patterns between the Opportunities that take the shortest and longest amount of time to close can help plan for future Opportunities better.
To utilize the Opportunity Report, please use the following steps:
Reports → Sales → Opportunity
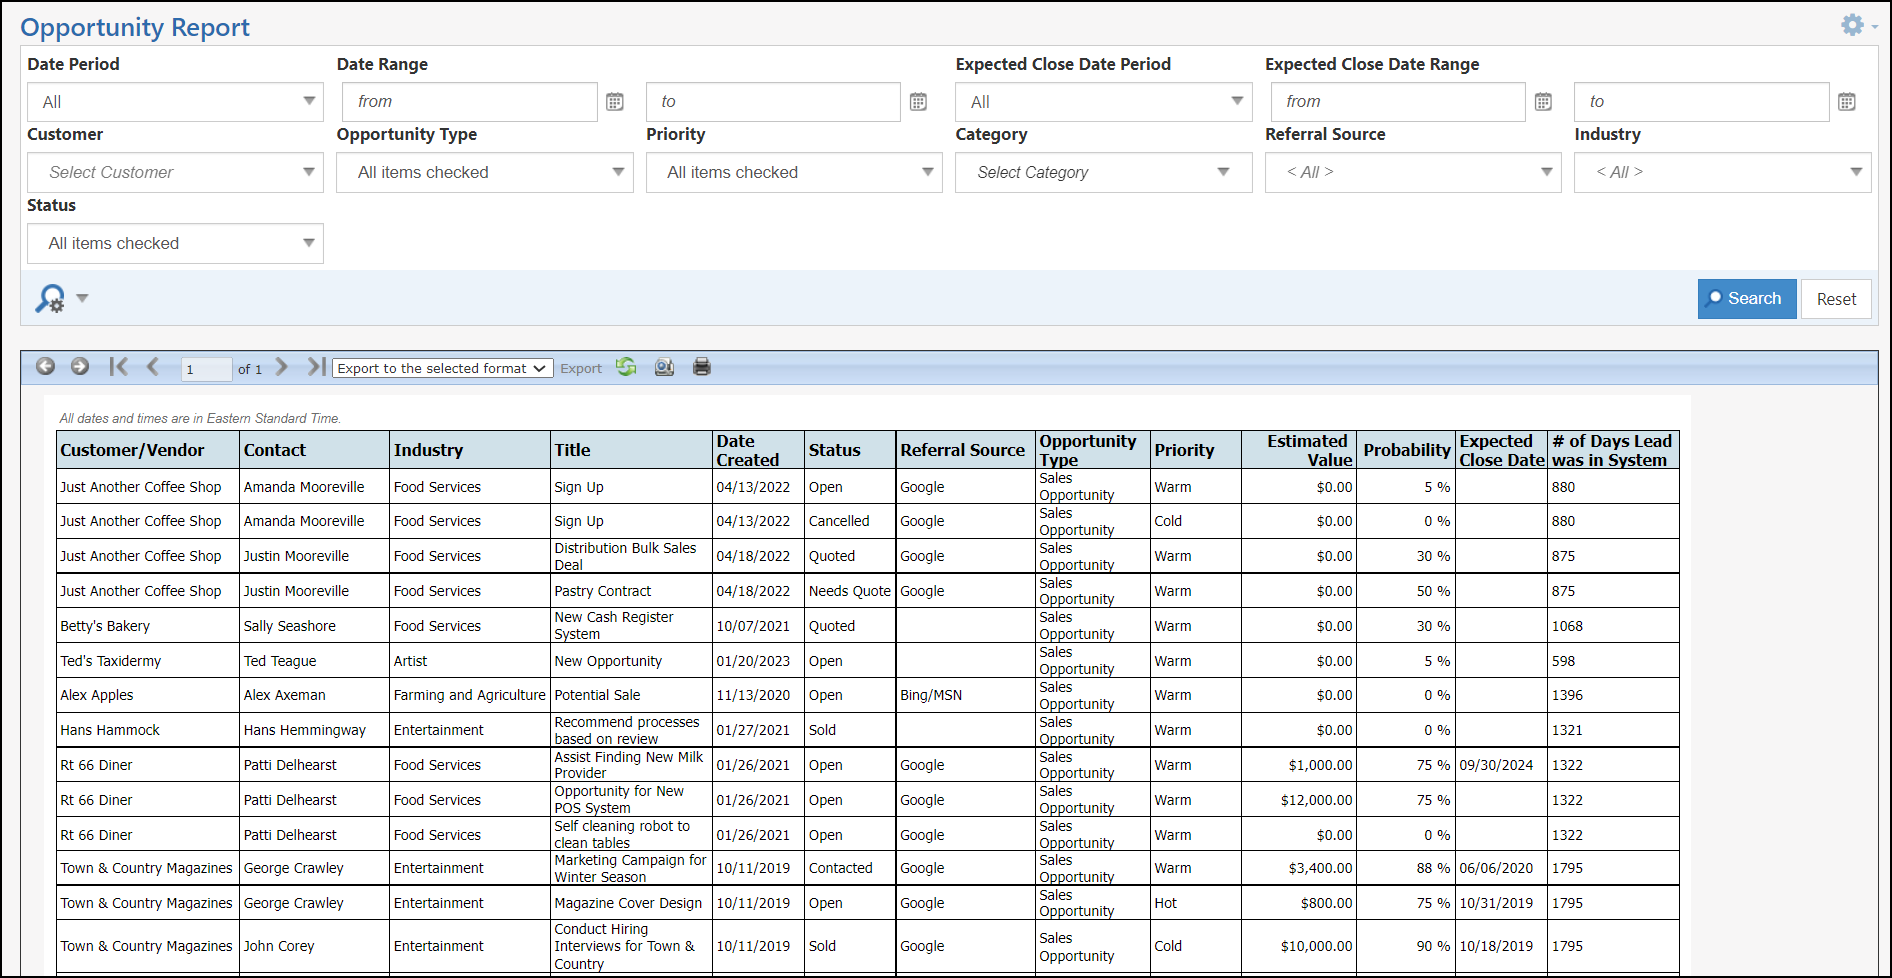
Example of Opportunity Report
-
Opportunity Pipeline Report
The Opportunity Pipeline Report is a useful tool to understand the conversions of Opportunities within a selected time period. This report will have two views available which includes the Cohort view and the Snapshot view. The report can be narrowed down by the stages to include in the report based on the Opportunity Types selected within the search filters.
To view the Opportunity Pipeline Report, navigate to Reports → Sales → Opportunity Pipeline.
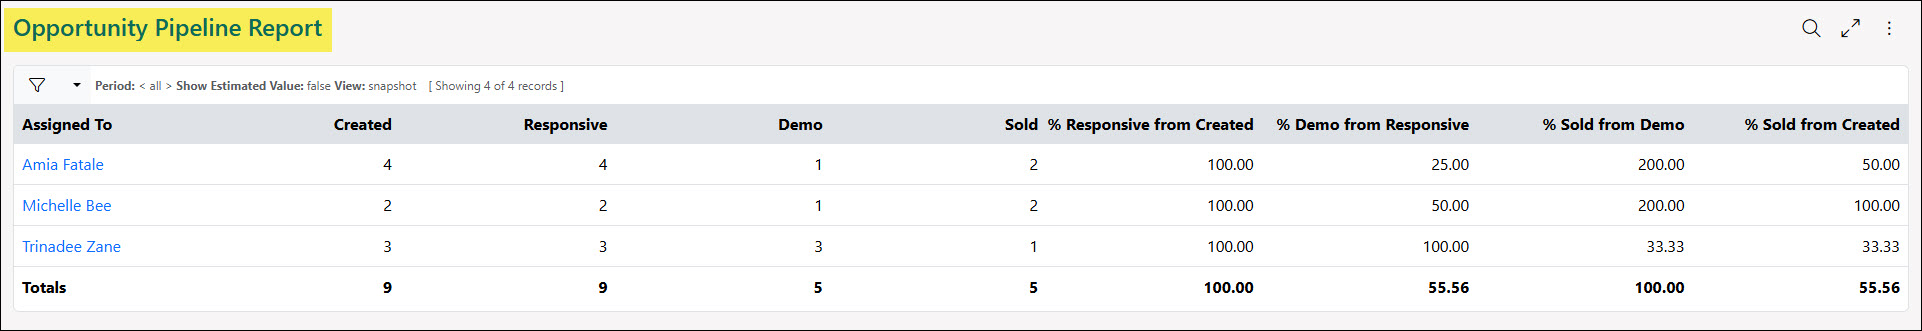
Example of the Opportunity Pipeline Report
-
Search Filters
Below is a screenshot illustrating how the Opportunity Pipeline search filters appears and a description of what can be accomplished there.
- Period/Date: Narrows results included in the report based on a selected past date range, including today, or with specific To and From dates entered.
- Assigned To: Adjusts results included in the report based on specific Employees that are assigned to Opportunities.
- Referral Source: Will only include Opportunities that have a specific referral source selected on the Opportunity.
- Customer Category: Narrows results in the report based on the Category that has been assigned to the Customer selected on the Opportunities.
- Industry: Narrows results in the report based on the Industry that has been assigned to the Customer selected on the Opportunities.
- Opportunity Type: Will only include Opportunities being included in the report based on the Opportunity Type selected. Depending on the types selected here, the Opportunity Stage search filter may adjust as stages are set per Opportunity Type.
- Opportunity Stage: Will remove columns in the report to only include stages selected in this search filter. Opportunity stages can be customized in your system and may vary from the examples shown in this guide.
- Exclude Stage: Stages here will be excluded from all computations including the Created column. It should be used for stages that determine if the opportunity was not valid or a duplicate or a canceled opportunity. Excluding stages that indicate an opportunity is Lost may skew the numbers and should be avoided.
- View: There are two views available when viewing the Opportunity Pipeline Report including:
- Cohort: The Cohort view will include all Opportunities created within the period of time selected in the search filters in order to track their conversion to different stages. The columns will not take into account if the Opportunity moved into a stage during the selected time period.
- Snapshot: The Snapshot view will include all Opportunities in the time period that is selected in the search filters regardless of their created date. For each stage selected, if the Opportunity was updated to that specific stage in the time period selected, it will show up in that column accordingly.
- Show Estimated Value: When enabled, the estimated value entered on the Opportunities will be displayed below each Stage listed in the report showing the total estimated value amount per Stage and per Assigned To with an overall total at the bottom of the report.

Example of the Search Filters Available on the Opportunity Pipeline Report
-
Report Columns
Below is a screenshot illustrating how the Opportunity Pipeline Report columns appear and a description of what can be accomplished there.
Note: The example below uses three (3) example stages: Responsive, Demo, and Sold. These stages can be customized from the Opportunity Stages page within the settings. Learn more about configuring these stages by reviewing the Opportunity Stages section from the Opportunities Guide.
- Assigned To: Lists the Employees who have Opportunities assigned to them. Clicking on the hyperlinked Employee’s name will open their Employee Information card for additional details on the Employee.
- Created: Includes a total amount of Opportunities that was created for each Employee listed in the report within the time period selected in the search filters. This will be the same regardless if the report is being viewed in the Cohort or Snapshot view.
- Responsive: The Responsive column will calculate the following information per view:
- Cohort View: Out of all the Opportunities created within the selected time period in the search filters, this will list how many went into the Responsive stage. It does not take into account the time period when the Opportunity went into the Responsive stage.
- Snapshot View: The total amount of Opportunities that went into the Responsive stage within the time period selected in the search filters.
- Demo: The Demo column will calculate the following information per view:
- Cohort View: Out of all the Opportunities created within the selected time period in the search filters, this will list how many went into the Demo stage. It does not take into account the time period when the Opportunity went into the Demo stage.
- Snapshot View: The total amount of Opportunities that went into the Demo stage within the time period selected in the search filters.
- Sold: The Sold column will calculate the following information per view:
- Cohort View: Out of all the Opportunities created within the selected time period in the search filters, this will list how many went into the Sold stage. It does not take into account the time period when the Opportunity went into the Sold stage.
- Snapshot View: The total amount of Opportunities that went into the Sold stage within the time period selected in the search filters.
- % Responsive from Created: Calculates the percentage of Opportunities that were created in the time period selected in the search filters and went into the Responsive stage.
- % Demo from Responsive: Calculates the percentage of Opportunities that were moved from the Responsive stage to the Demo stage during the time period selected in the search filters.
- % Sold from Demo: Calculates the percentage of Opportunities that were moved from the Demo stage to the Sold stage during the time period selected in the search filters.
- % Sold from Created: Calculates the percentage of Opportunities that were created in the time period selected in the search filters and went into the Sold stage.
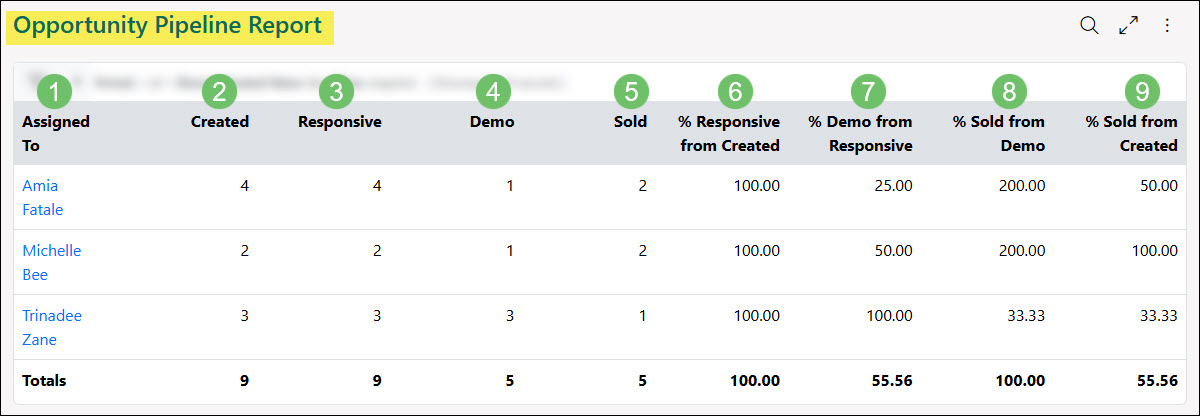
Example of the Columns Available on the Opportunity Pipeline Report
-
Export Report
The Opportunity Pipeline Report can also be exported in order to view the data in an external spreadsheet program. To export the Opportunity Pipeline Report, click the Export button located in the top-right corner of the report. Below is a screenshot illustrating where the Opportunity Pipeline Report can be exported.

Example of the Export Option on the Opportunity Pipeline Report
-
Customer Category Report
The Customer Category Report is a great way to get an idea of what the close-ratio is for Customers per Category set at the Customer level. This report will display the number of Leads per Category as well as a column for how many of the Customers converted to have a Customer/Vendor Since date. This information is then calculated to show the close-ratio per Customer Category in a percentage form.
To utilize the Customer Category Report, please follow these steps:
Reports → Sales → Customer Category
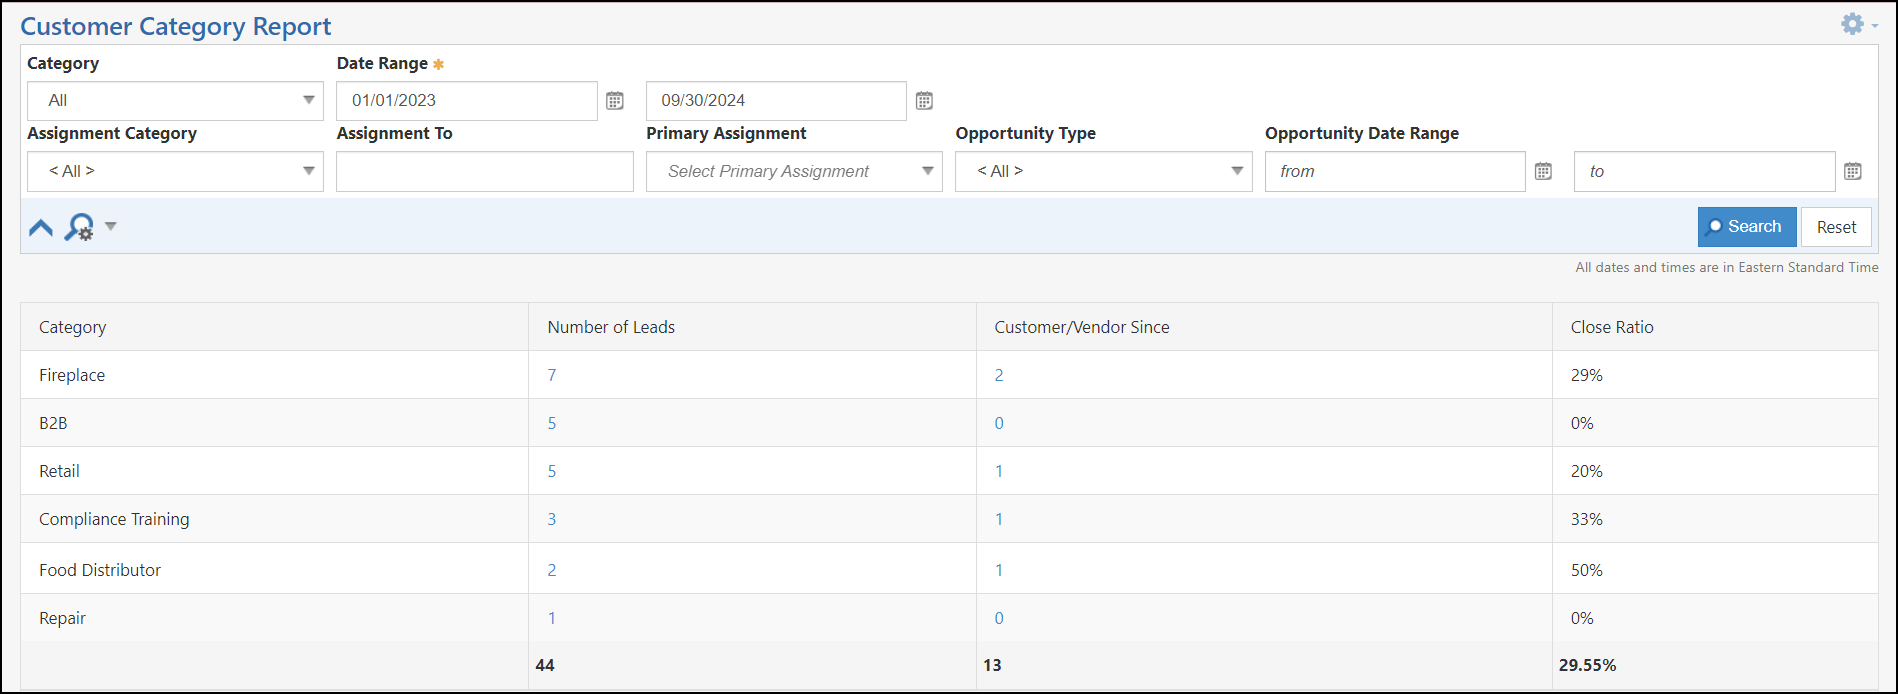
Example of Customer Category Report
-
Recap
With this guide, we’ve discussed how to create and manage your CRM Dashboard to give insight into your overall financial activities within Striven. We’ve reviewed a variety of different reporting options to further your understanding of how your Company is doing financially and where there may be room for improvement. These reports can also help you find Customer/Vendor-specific statistics or metrics that will provide a deeper look into your business relationships through Striven.
Have a Question?
Ask the Striven Community
User-sourced how-to’s, feedback, and more!
FAQs
-
What is the difference between the CRM Dashboard and a Customer Dashboard?
The CRM Dashboard provides an overall view of financial data based on all of your Customers in one place, while a Customer Dashboard would only display financial data specific to a particular Customer. The widgets on the CRM Dashboard will use metrics from all of your Customers combined to show, for example, all Payments received for a particular time period. On the Customer Dashboard, the Payments widget will only show Payments received from a single Customer for that time period. This means the CRM Dashboard will give you a clearer idea of how your Company’s overall finances are flowing rather than just related to one Customer.