Financials
Financial Reporting
Support Guide
-
Overview
As you begin to manage your accounting and financials within Striven, you will begin using the built-in reports regularly to have an insight as to how your Company is performing. Each report is designed to allow you to drill into the details and also set your search parameters to see exactly what you are looking for. This guide will help keep track of your finances with the useful assistance of these financial reporting features.
Read this guide if you are trying to:
✔ Determine if your Company reports finances based on Accrual or Cash basis.
✔ Explore and familiarize yourself with the financial reporting features in Striven.
✔ Report on finances using the variety of built-in reporting features.
-
Accrual vs. Cash
The way in which your Company reports finances is a basic, but very important function that Striven can help you accomplish easily. There are two methods to report finances; the Accrual Basis and the Cash Basis. If you report on finances when revenue is earned and costs are incurred, your Company uses the Accrual Basis of Accounting. If you report on finances when revenue is received and expenses are recognized, then your Company uses the Cash Basis of Accounting.
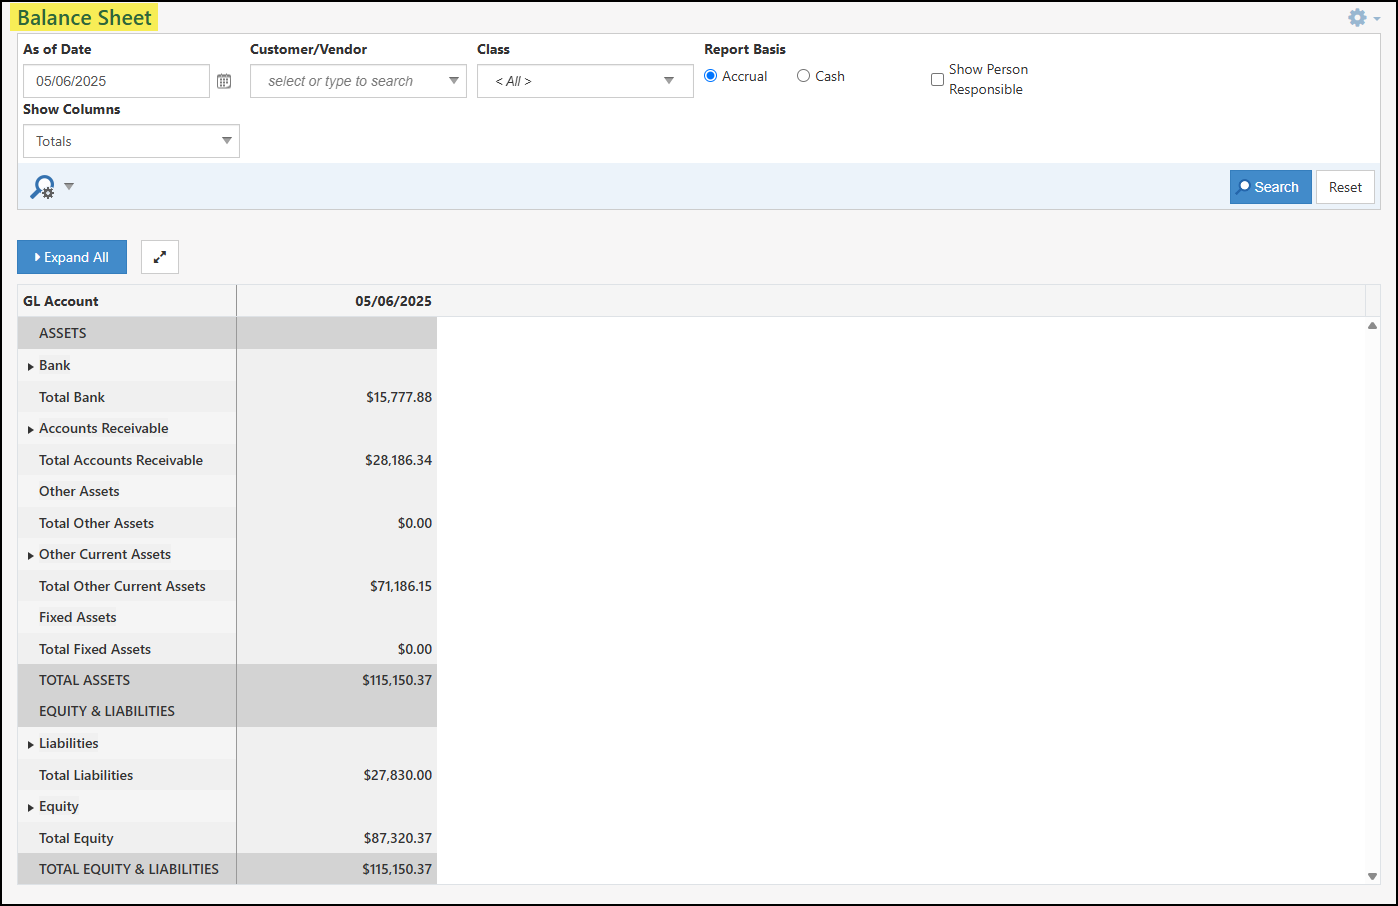
Financial reports in Striven, such as the Balance Sheet, Profit & Loss, and Trial Balance all include the option to report based on either Accrual or Cash basis of accounting. To change how you report on finances, simply click Accrual or Cash and click search to load your results. Below is a screenshot illustrating how the Reporting Basis appears on a Balance Sheet.
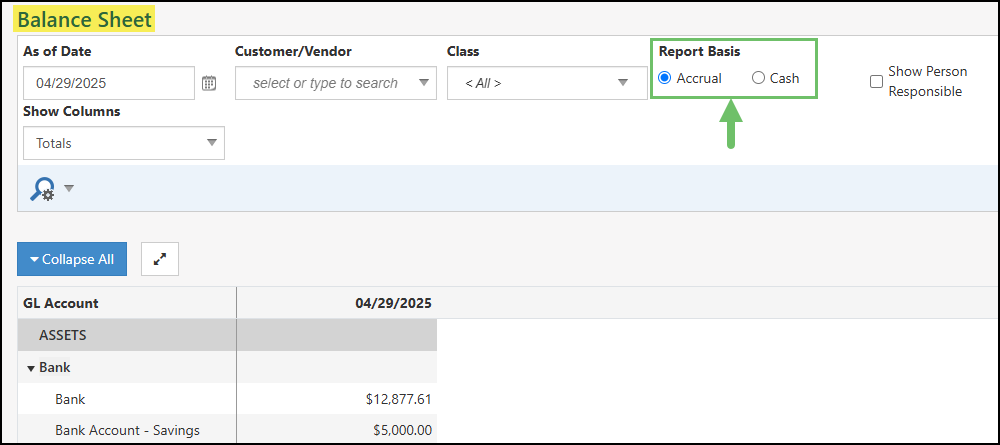
Example of Reporting Basis on Balance Sheet Report

-
Postings Report
The Postings Report gathers all transaction Posting Journal data based on the filter criteria of the report and lists them neatly to help analyze and organize your financial data within Striven.
Permissions
There are two (2) User Role permissions related to the Postings Report.
- “Postings Report – Export” : This permission will be required to export the report to Excel.
- “Postings Report – View” : This permission will be required in order to view the report in Striven.
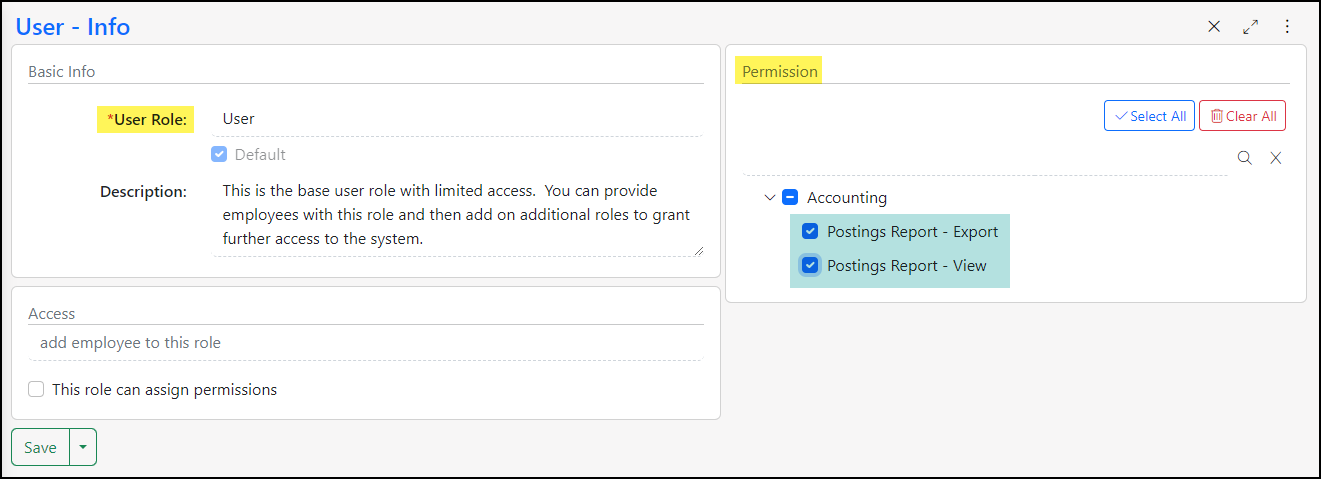
Example of the User Role Permissions Related to the Postings Report
Viewing the Postings Report
This report can be located by navigating to Accounting → Postings.
Here is a description of the variety of elements found on this report:

Example of the Filter and Menu Options on the Postings Report Page
- In the top right corner of the page you will find:
- Search (magnifying glass): Shows editable filters to determine which results display in the report. (This will be described in further detail below).
- Fullscreen Toggle (arrows): Expands the visibility of the page to allow more room to show content and hides page elements, such as the header, menu, and Favorites. Click again to return to the normal view.
- More Menu (kebab): Houses the following options:
- Settings: Displays the permissions needed in your User Role settings to access the information on the page.
- Make Landing Page: Enables you to save this page as your Landing Page in Striven.
- Default Settings: Displays the default search filter settings for the report.
- Note: The page will automatically display the Date Period for This Month, but this can be edited using the Search option.
- Sort: Allows you to sort the results by Date, Type, Debit Amount, or Credit Amount.
- Export: Provides the option to export the report to Excel.
There are a variety of search filter options available from the Search popup on the Postings Report page to narrow down the results of your report, such as:
- Account
- Customer/Vendor
- Type (which has a multi-select control to allow for the selection of multiple transaction types).
- Transaction #
- Date Created Period
- Date Created Range
- Created By
- Item
- Class
- Location
- Voided Status
- Date Modified Period
- Date Modified Range
- Modified By
- Debit Amount (options include > =, < =, and =, along with an amount input field).
- Credit Amount (options include > =, < =, and =, along with an amount input field).
- Include Foreign Debit/Credit checkbox (appends the exchange rate currency symbol and the foreign debit/credit columns to the report).
- Foreign Currency
- Report Basis: Accrual or Cash
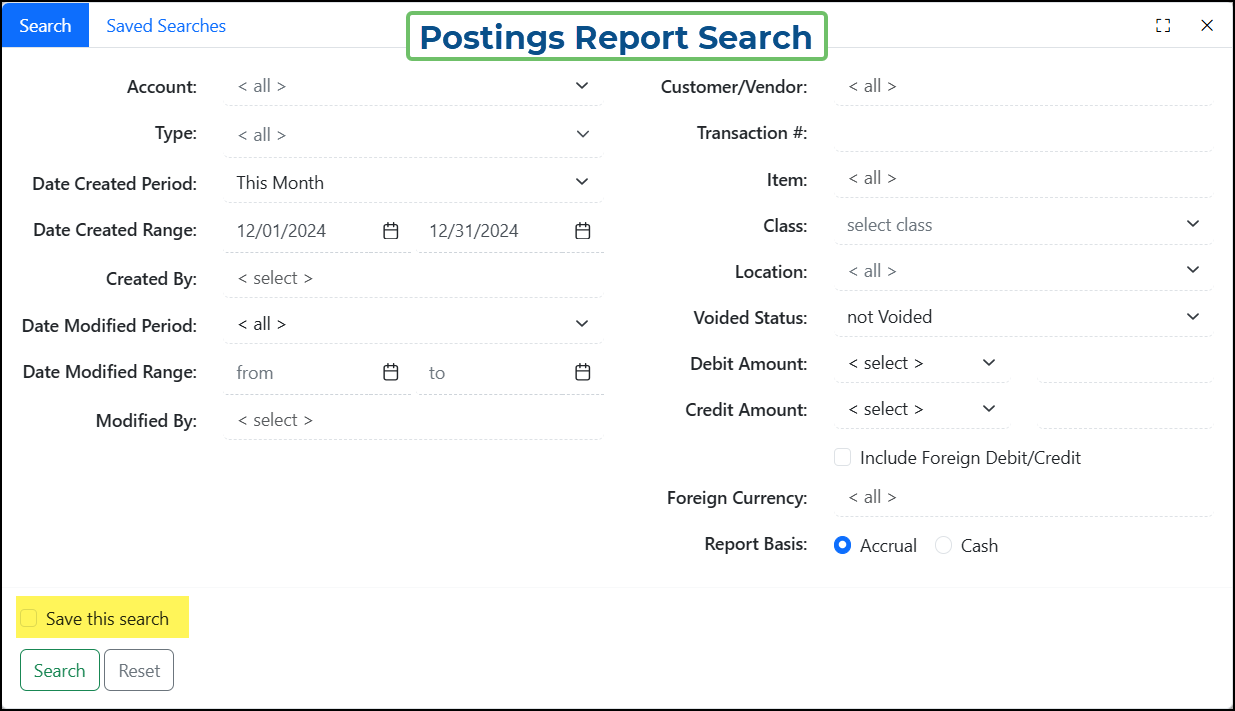
Example of the Available Search Filters for the Postings Report
Note: This Search menu also offers a Saved Search option to remember your filters for future use.
The available columns on this report include Account, Type, Transaction #, Date, Customer/Vendor, Item/Location, Class, Debit, and Credit.
- Note: If the Foreign Currency checkbox is checked, the Exchange Rate/ Currency Symbol and Foreign Debit/Credit columns will also display.
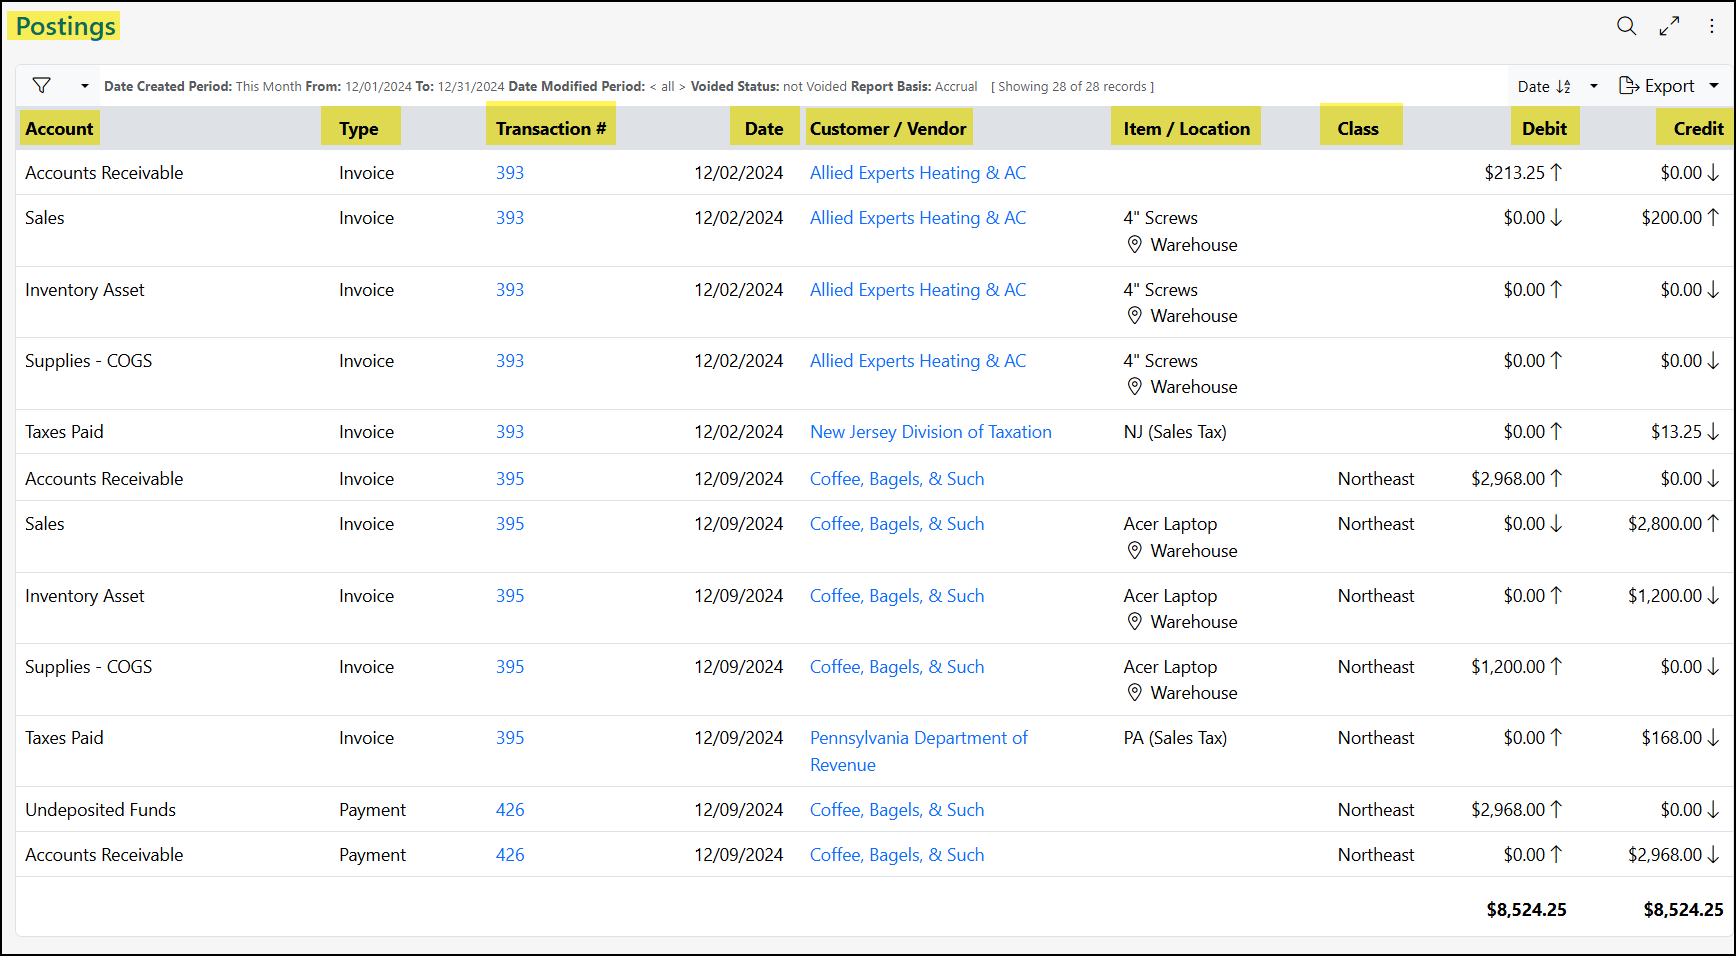
Example of Postings Report Columns
You will also have the ability to sort this report by Date, Type, Debit Amount, or Credit amount, as desired.
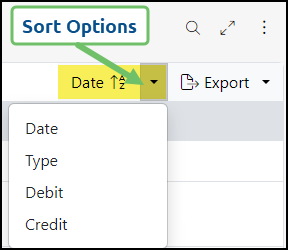
Example of the Available Sorting Options for the Postings Report
-
Profit & Loss Reports
The Profit & Loss (P&L) Reports in Striven can be the most insightful with regard to how your Company is doing financially. Reporting as of a certain date allows you to drill in and review more information about what makes up your profits and losses within your Striven system. The following P&L Reports are available in Striven:
- P&L: Displays your Company’s total income and expenses in a set period of time. This will then calculate what your Net Profit is at any given time. Accrual basis and Cash basis are available as reporting options with regard to the P&L Report. Switching to the chart view will allow you to report in a visual way on your total income and expenses. Clicking on the hyperlinked dollar amounts in the report will also allow you to drill into the details.
To run the P&L Report in Striven, navigate to Reports → Financials → P&L.
- P&L by Class: Allows you to run your P&L separated out by Classes that have previously been set up in Striven. A filter is available in order to view the report with only the selected Classes you wish to see. This filter will remember your behavior and keep the same filters intact the next time the report is visited.
To run the P&L by Class Report in Striven, navigate to Reports → Financials → P&L by Class.
- P&L Comparison: The P&L Comparison Reports allows you to compare one time period to previous time periods or a preset Budget & Forecast. Multiple reports can be created in order to allow flexibility in what is being compared. Within one report, multiple comparisons can be added in order to conduct extensive analysis on your financials.
To run the P&L Comparison Report in Striven, navigate to:
Reports → Financials → P&L Comparison and select Add Report.- Customer P&L Comparison: Allows you to compare one time period to another related to a particular Customer. This is a useful report to compare two periods in order to identify potential changes in profit and maintain accurate records.
To run the Customer P&L Comparison Report in Striven, navigate to:
Reports → Income & Receivables → Customer P&L Comparison.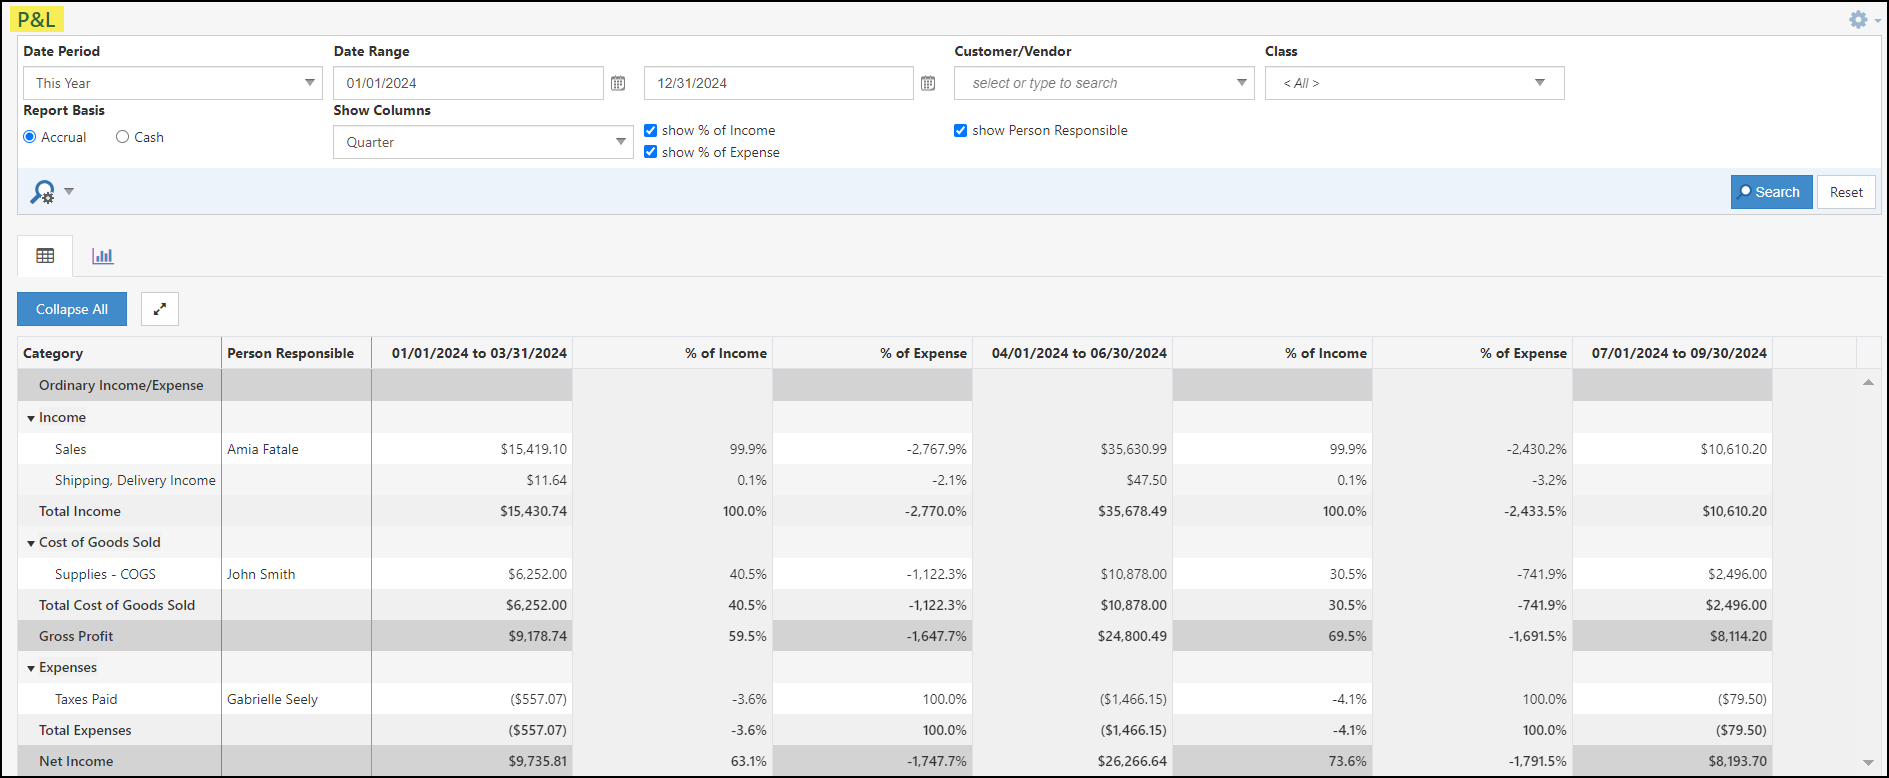
Example of Profit & Loss
-
P&L
The Profit & Loss (P&L) Report details your company’s revenues and expenditures across a chosen timeframe, revealing your net earnings. This report can be generated using either the Accrual or Cash accounting method.
Example of the P&L Report
Permissions
The following permissions will need to be configured for the Employee’s User Role if they will be managing or viewing the P&L Report in Striven:
- “P&L Report – Export”
- “P&L Report – View”
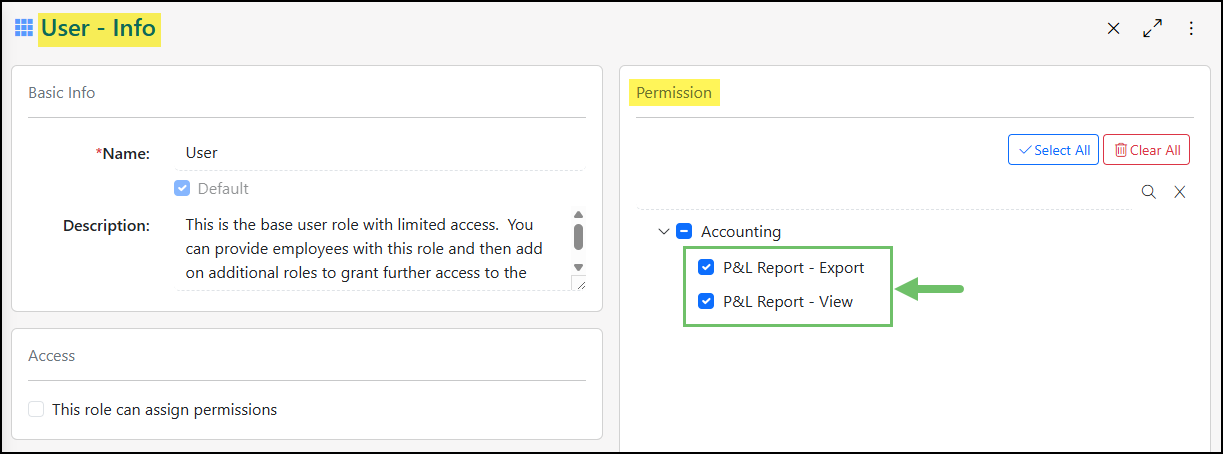
Example of the P&L Report Permissions
Learn more about managing User Roles and Permissions in Striven by reviewing the User Roles Guide.
Viewing the P&L Report
To access the P&L navigate to Reports → Financials → P&L.
Below is a screenshot illustrating how the P&L Report appears and a description of what can be accomplished there.
- Date Period/Range: By default the report will be set to This Month as the Date Period. The Date Period filter can be used for pre-set date periods or specific dates can be entered into the Date Range fields.
- Customer/Vendor: Allows you to filter the report down to a single Customer or Vendors related income and expenses that feed into the P&L Report.
- Class: Allows you to multi-select Classes in order to narrow down the P&L to only income and expenses related to those Classes. The P&L By Class Report (which is detailed in the next section of this guide) will set these Classes as separate columns in the report.
- Report Basis: Adjusts the report based on if your Company utilizes the Accrual or Cash Basis for Accounting. Review the Accrual vs Cash section in this guide to learn more about the difference in reporting options.
- Show Columns: Adds additional columns to the report based on the Week, Month, Quarter, or Year that falls within your selected Date Period or Date Range. Options are available to also show the % of Income and the % of Expense. If a user is set within the Chart of Accounts’ GL Account for the Person Responsible, this column can be added as well.
- Table/Chart View: Allows the user to toggle between a table view and a chart view. By default the report will be displayed in the table view.
- Collapse/Expand All: Expands the report so only the totals for the Income, Cost of Goods Sold, and Expense type of GL Accounts are displayed. By default the report will be expanded, but can easily be collapsed once selected using the same button.
- Full-Screen: Brings the P&L Report into a full-screen view to easily see more of the report. This option will remove the Striven Menu and the search filters so only the report results are being viewed.
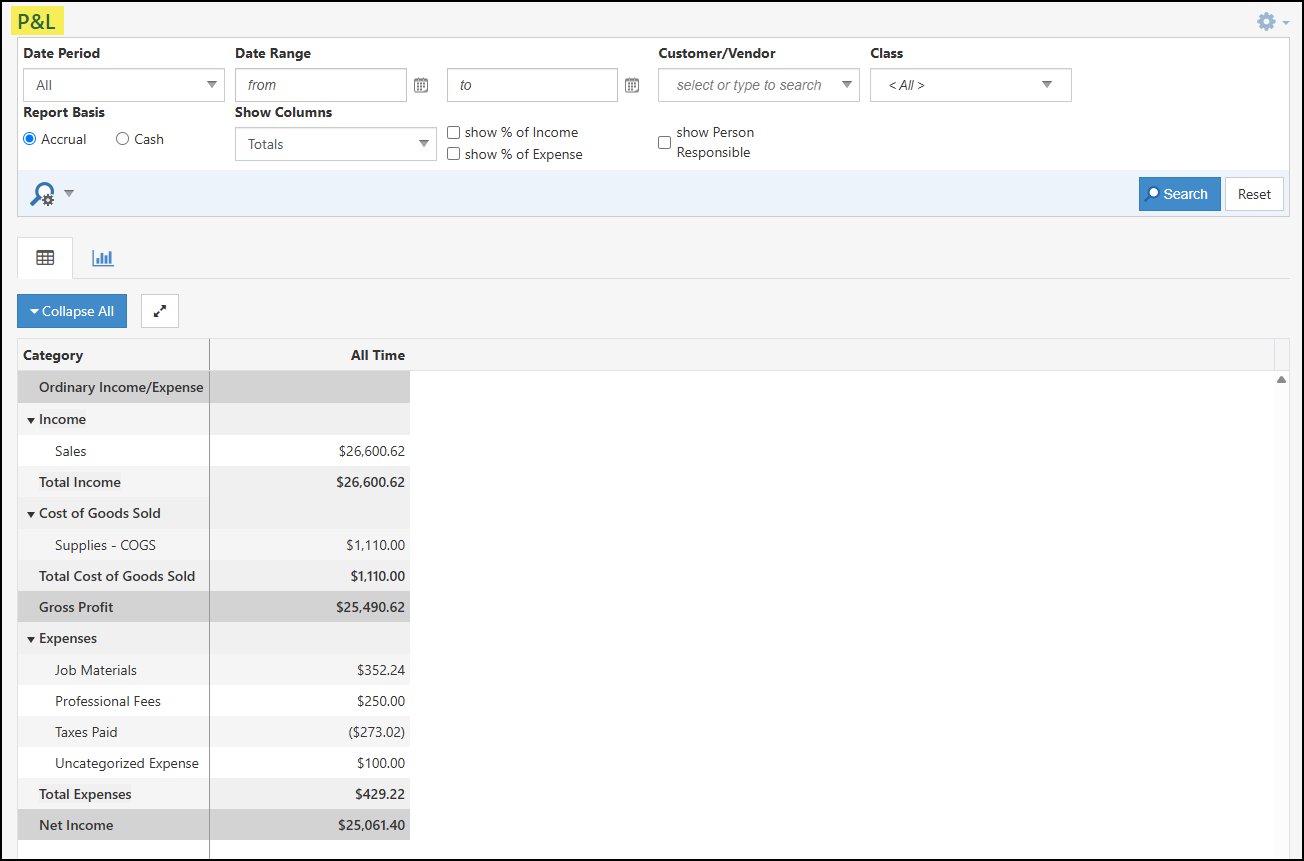
- Report Columns: By default, the P&L Report will list the following columns and information (See section below for more information regarding the additional columns that can be added using the Show Columns filter options):
- Category: Lists the GL Accounts along with header accounts for each type of account.
- Date Range: Lists the total calculated amount for each GL Account listed. A calculated row will also be displayed for the Gross Profit (Income – Cost of Goods Sold) and the Net Income (Gross Profit – Total Expenses).
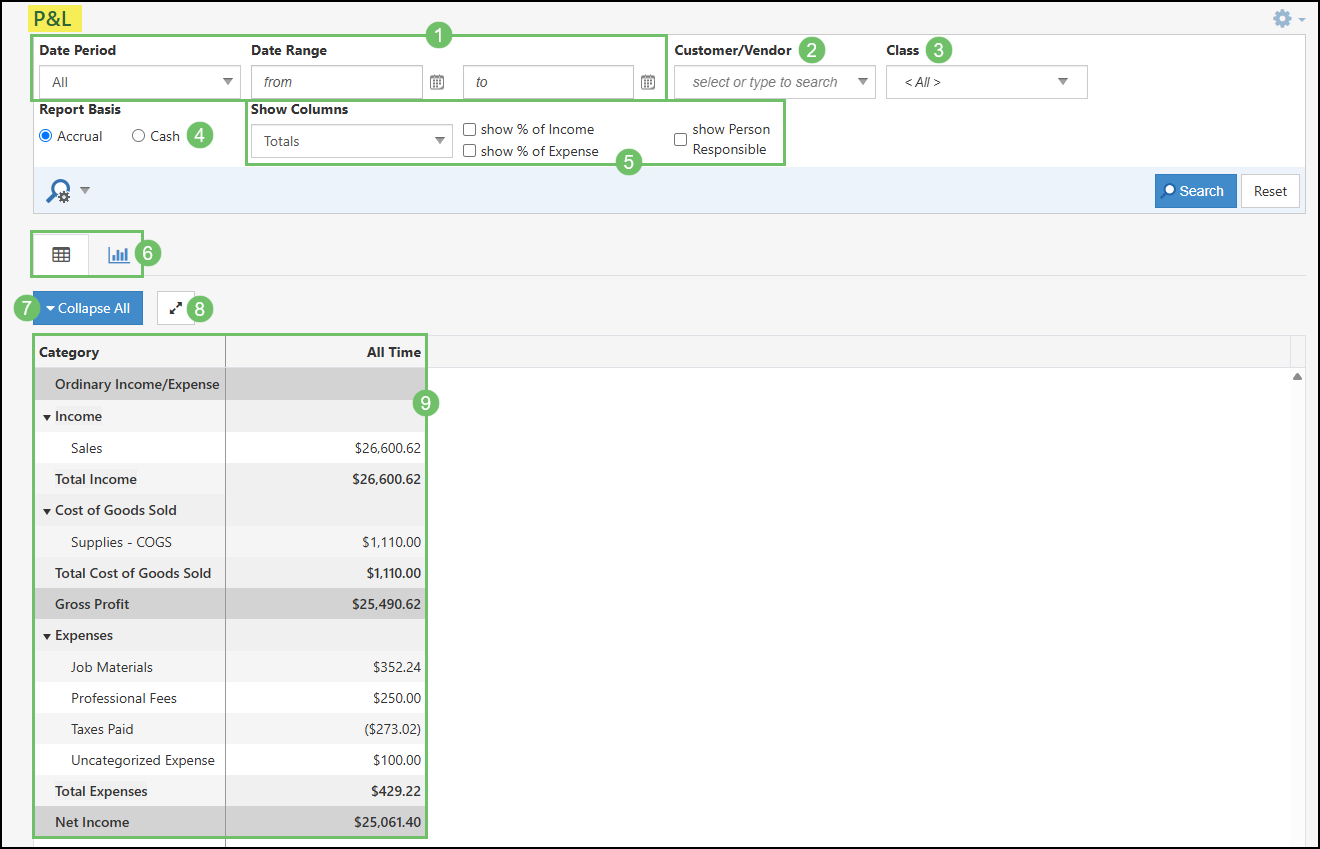
Example of Columns and Filters on the P&L Report
Show Columns Configurations
As mentioned above, the P&L Report can be configured to display additional columns and information in the results of the report. The following options are available to display additional columns in the P&L Report:
- Show Columns: With the set Date Range, the report can be adjusted to display the totals broken into separate columns for Week, Month, Quarter, and Year.
- Show % of Income: Breaks the report out into a separate column to see how much of the amount listed for the GL Account is making up the Income that is being calculated in the report.
- Show % of Expense: Breaks the report out into a separate column to see how much of the amount listed for the GL Account is making up the Expense that is being calculated in the report.
- Show Person Responsible: Lists the user that is selected in the Person Responsible field when editing a GL Accounts from the Chart of Accounts.
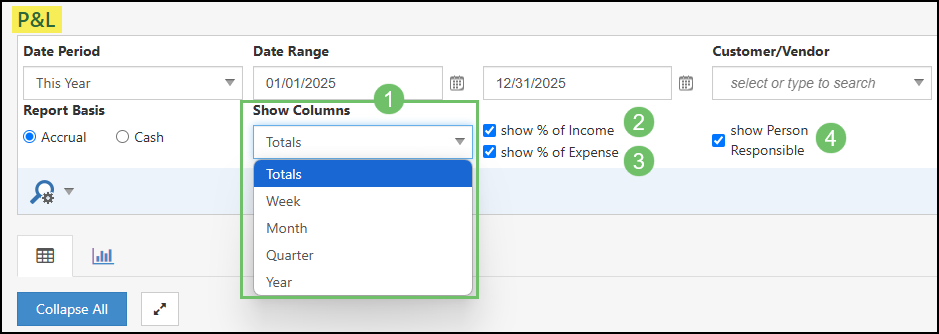
Example of Show Columns Options on P&L Report
Below is an example of the P&L Report which is configured to show the results for This Year, but broken down by Quarter. This example also displays how the report would appear with the options toggled on for Show % of Income, Show % of Expense, and Show Person Responsible:
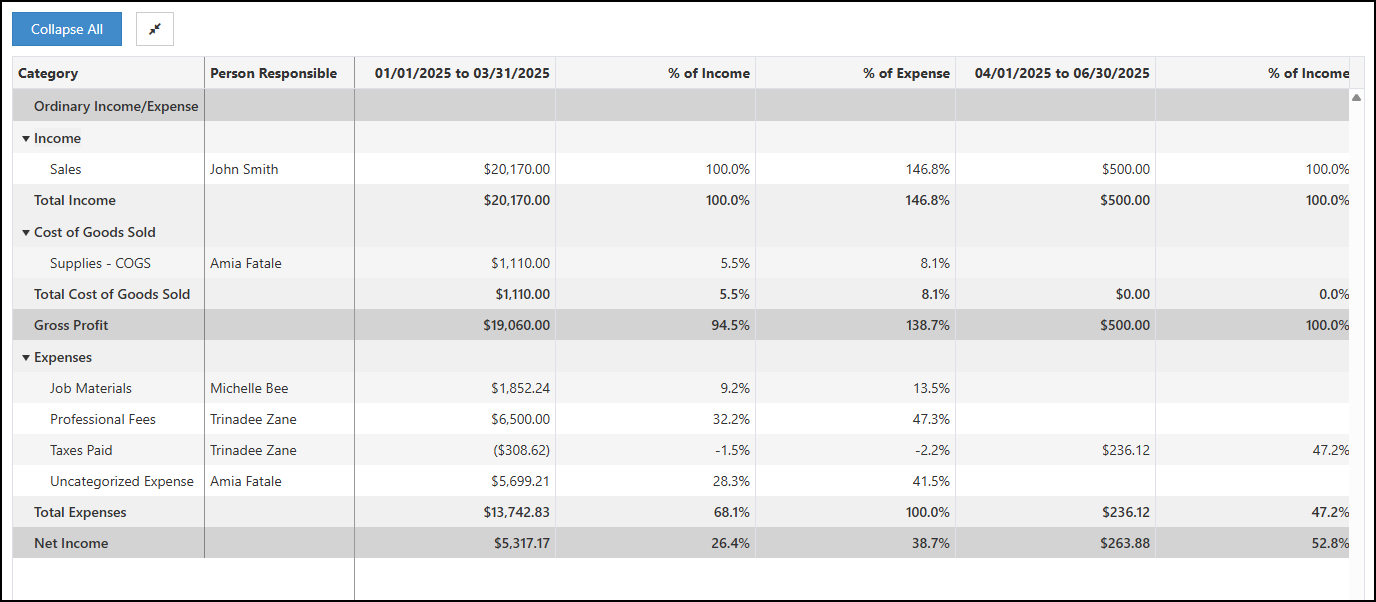
Example of the P&L Report with Show Columns Options Configured
Chart View
A Chart View option is available when viewing the P&L Report in order to view the results in a graphical view. The search filter configure options remain the same whether you are viewing the P&L Report in the table or the chart view.
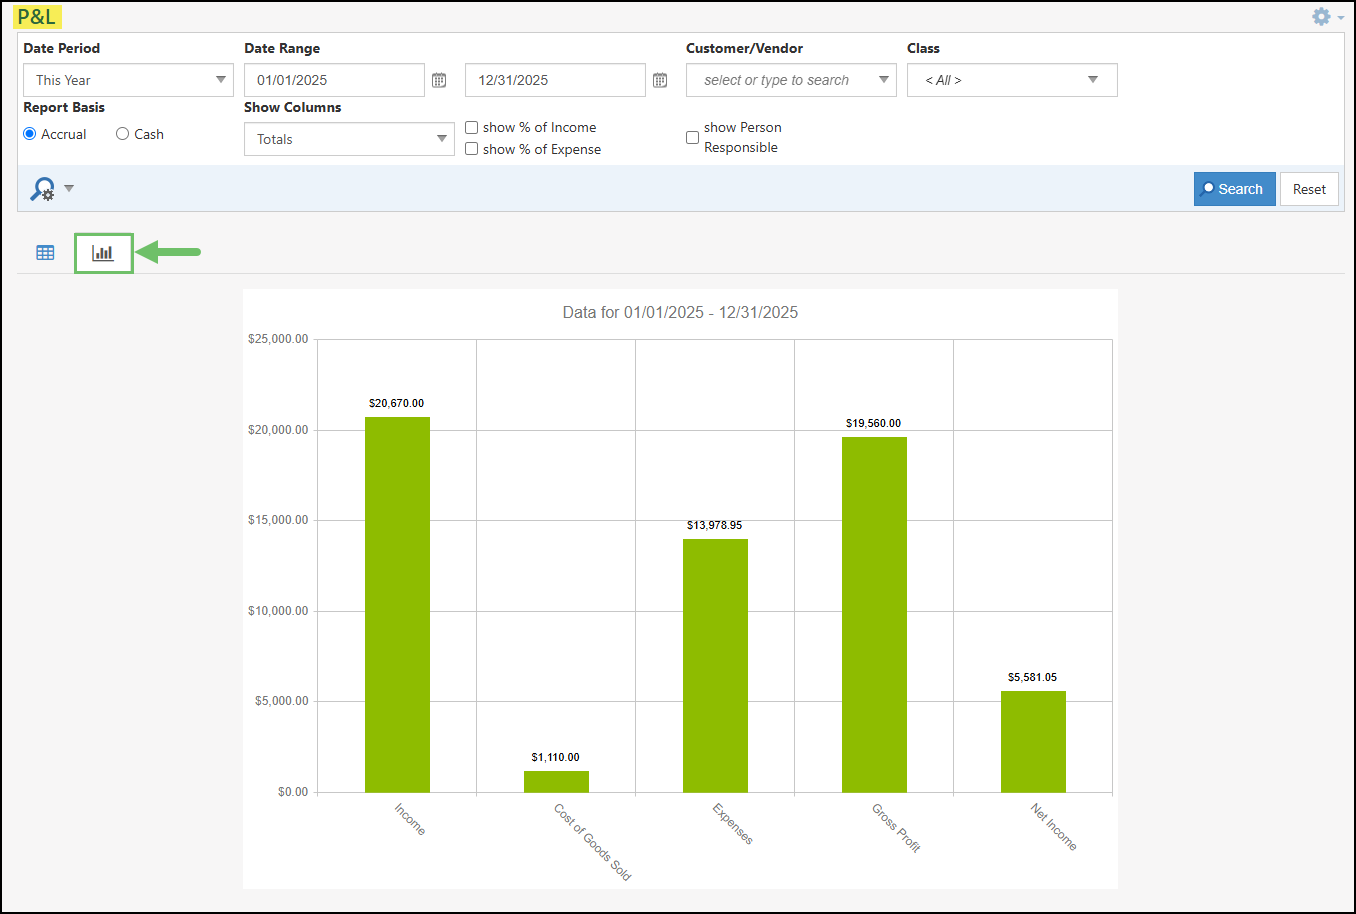
Example of the P&L Report in Chart View
The image to the right is an example of the P&L Report in the chart view which is configured to show the results for Last Quarter, but broken down by Month. This example also displays how the report would appear with the options toggled on for Show % of Income and Show % of Expense.
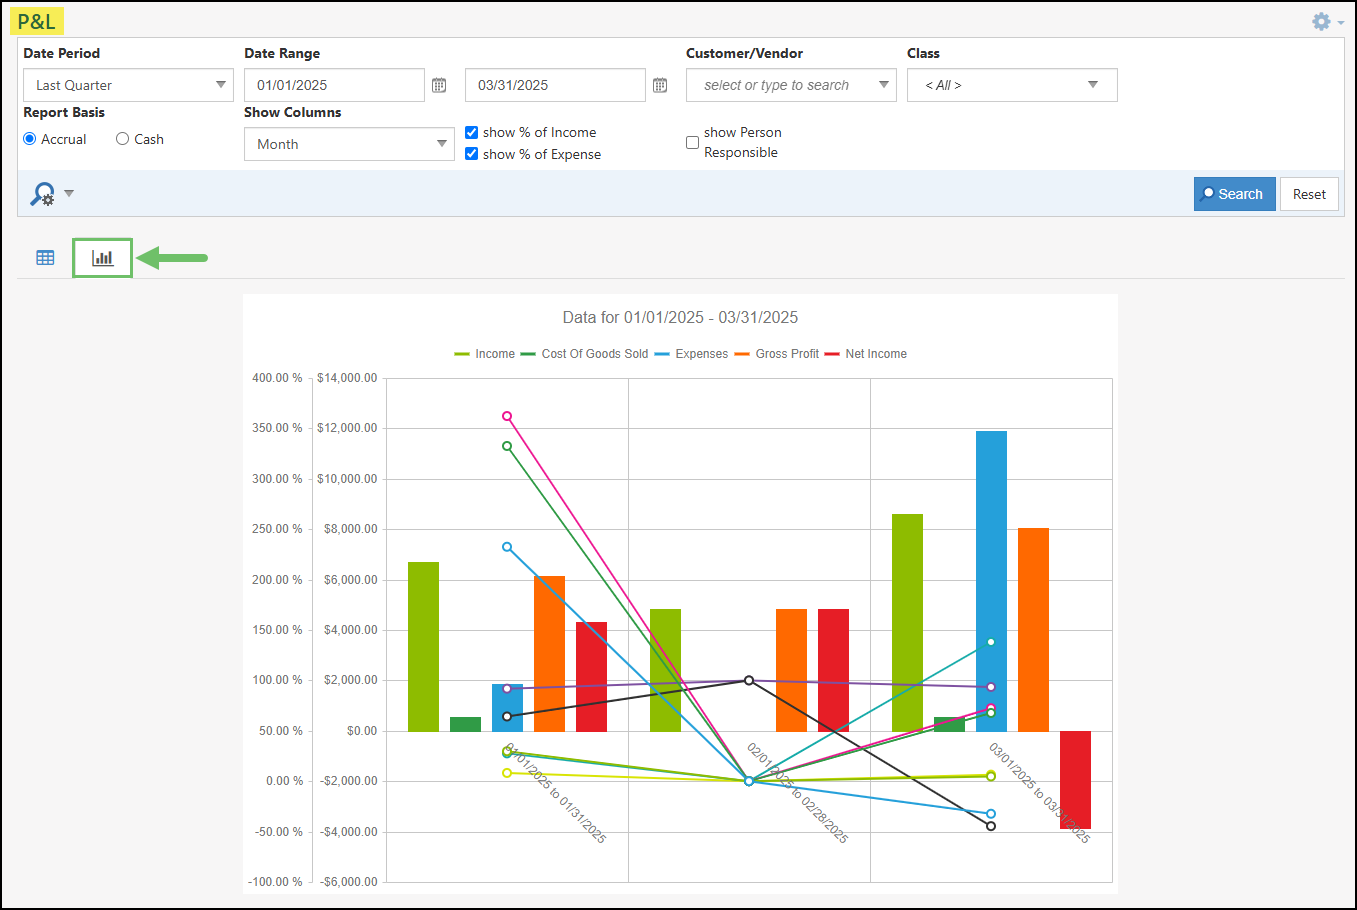
Example of the P&L Report in Chart View with Show Columns Options Configured
-
P&L By Class
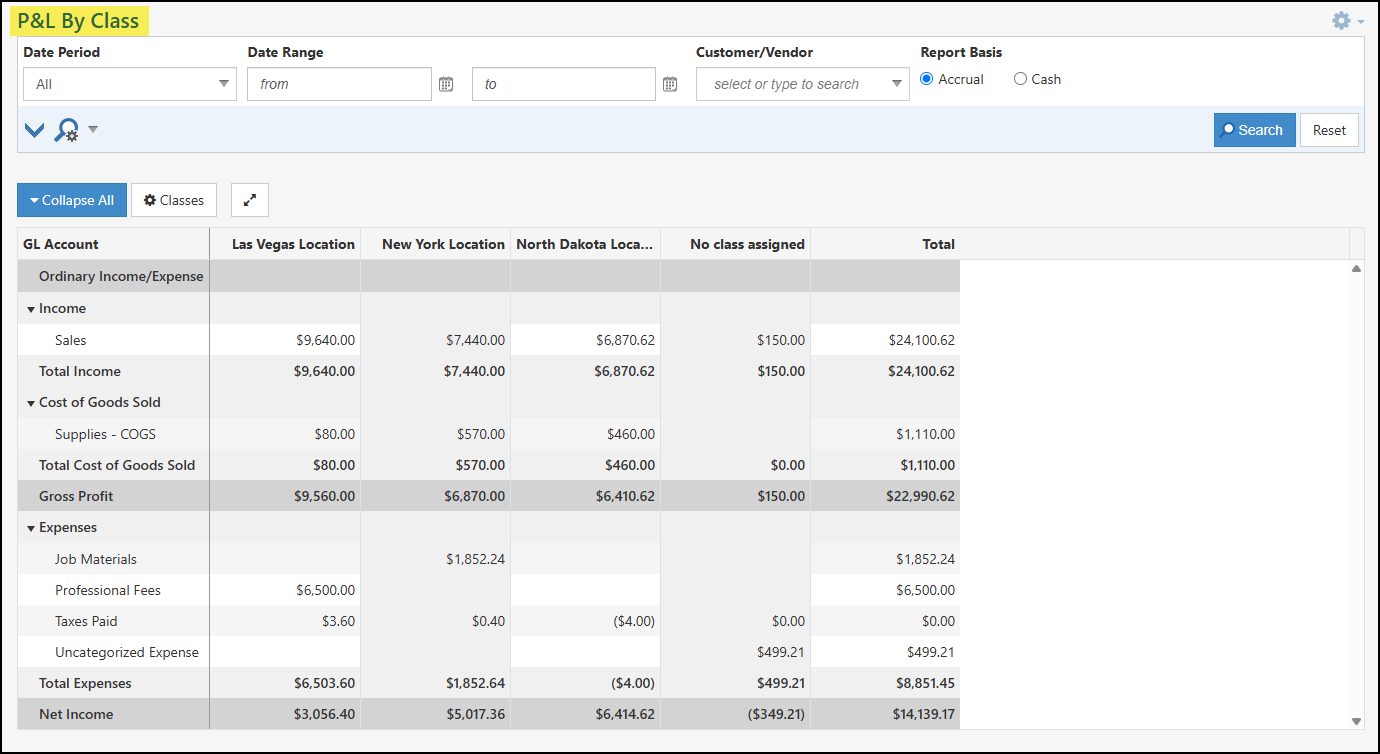
The P&L By Class Report enables users to view their Profit and Loss statements categorized by predefined Classes within Striven. A filtering option allows for focusing the report on specific Classes. This filter retains user preferences for future visits.
Example of the P&L By Class Report
Permissions
The following permissions will need to be configured for the Employee’s User Role if they will be managing or viewing the P&L by Class Report in Striven:
- “P&L Report By Class – Export”
- “P&L Report By Class – View”
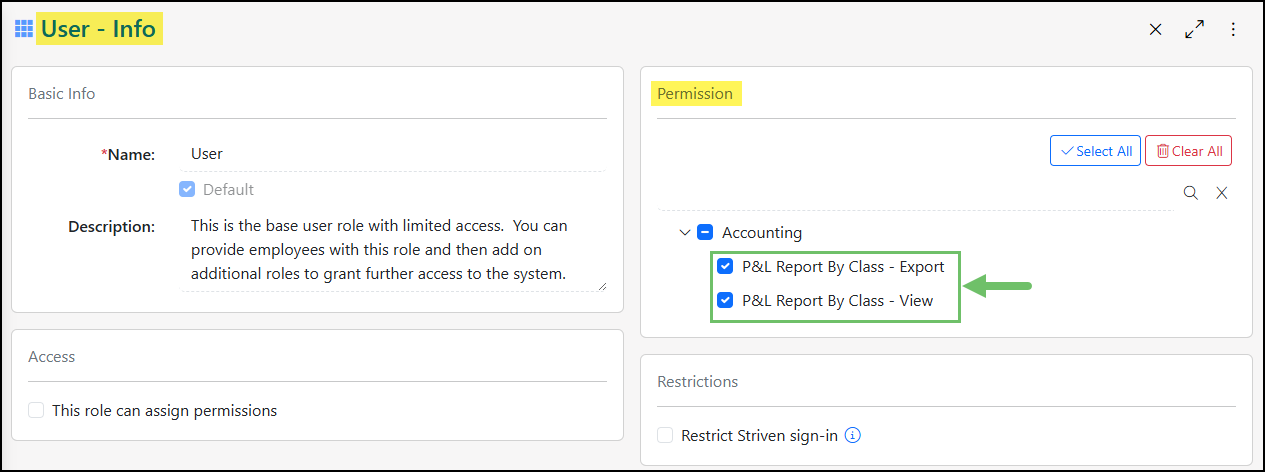
Example of the P&L By Class Report Permissions
Learn more about managing User Roles and Permissions in Striven by reviewing the User Roles Guide.
Viewing the P&L By Class Report
To access the P&L By Class Report navigate to Reports → Financials → P&L By Class.
Below is a screenshot illustrating how the P&L by Class Report appears and a description of what can be accomplished there.
- Date Period/Range: By default the report will be set to This Month as the Date Period. The Date Period filter can be used for pre-set date periods or specific dates can be entered into the Date Range fields.
- Customer/Vendor: Allows you to filter the report down to a single Customer or Vendors related income and expenses that feed into the P&L By Class Report.
- Report Basis: Adjusts the report based on if your Company utilizes the Accrual or Cash basis for Accounting. Review the Accrual vs Cash section in this guide to learn more about the difference in reporting options.
- GL Account/Type: Allows you to filter the report to specific types of GL Accounts including Income, Other Income, Cost of Goods Sold, Expense, or Other Expense.
- Collapse/Expand All: Expands the report so only the totals for the Income, Cost of Goods Sold, and Expense type of GL Accounts are displayed. By default the report will be expanded, but can easily be collapsed once selected using the same button.
- Classes: Allows the report to be narrowed down based on certain Classes selected. Options also include No Class Assigned and Include Inactive Classes. Classes that are not selected from this configuration will be removed from the results.
- Full-Screen: Brings the P&L By Class Report into a full-screen view to easily see more of the report. This option will remove the Striven Menu and the search filters so only the report results are being viewed.
- GL Account: Lists the GL Accounts along with header accounts for each type of account that is being calculated into the report.
- Class Columns: Each Class will be represented by a column. Clicking on the dollar amount listed will open a detailed list of what Transactions affecting the total listed.
- No Class Assigned: Any Transactions or line Items that do not have a Class assigned will be totaled in the No Class Assigned column. Clicking on the dollar amount will open a detailed list of the Transactions.
- Total: Sums the results for the Class columns and the No Class Assigned columns in order to view an overall Total.
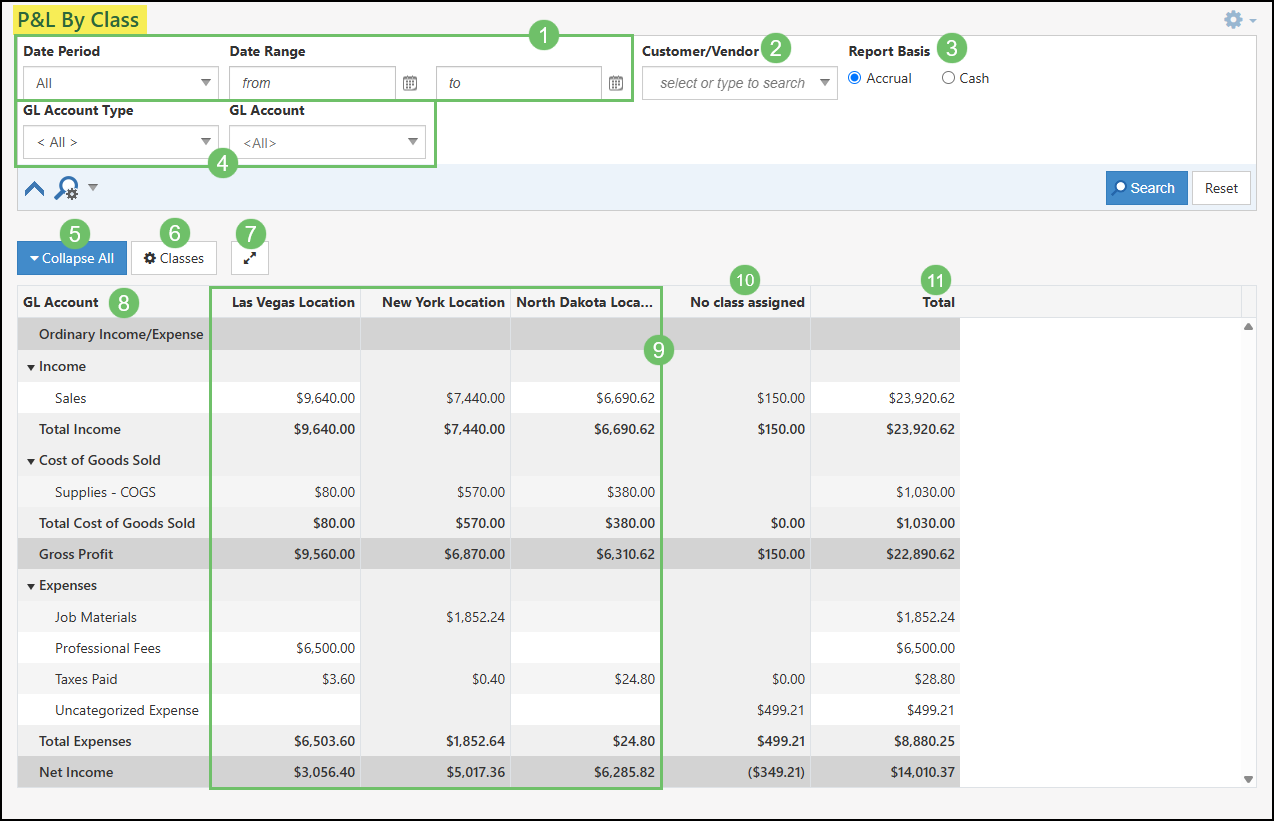
Example of the P&L By Class Report with Search Filters and Results Configured
-
P&L Comparison
P&L Comparison Reports are a powerful tool for financial analysis, allowing users to compare financial performance against prior periods, budgets, and forecasts to identify trends and growth, monitor performance, and analyze variances. The system’s flexibility enables users to generate numerous tailored comparison reports with multiple comparison sets for layered analysis, facilitating the identification of changes and relationships across different periods.
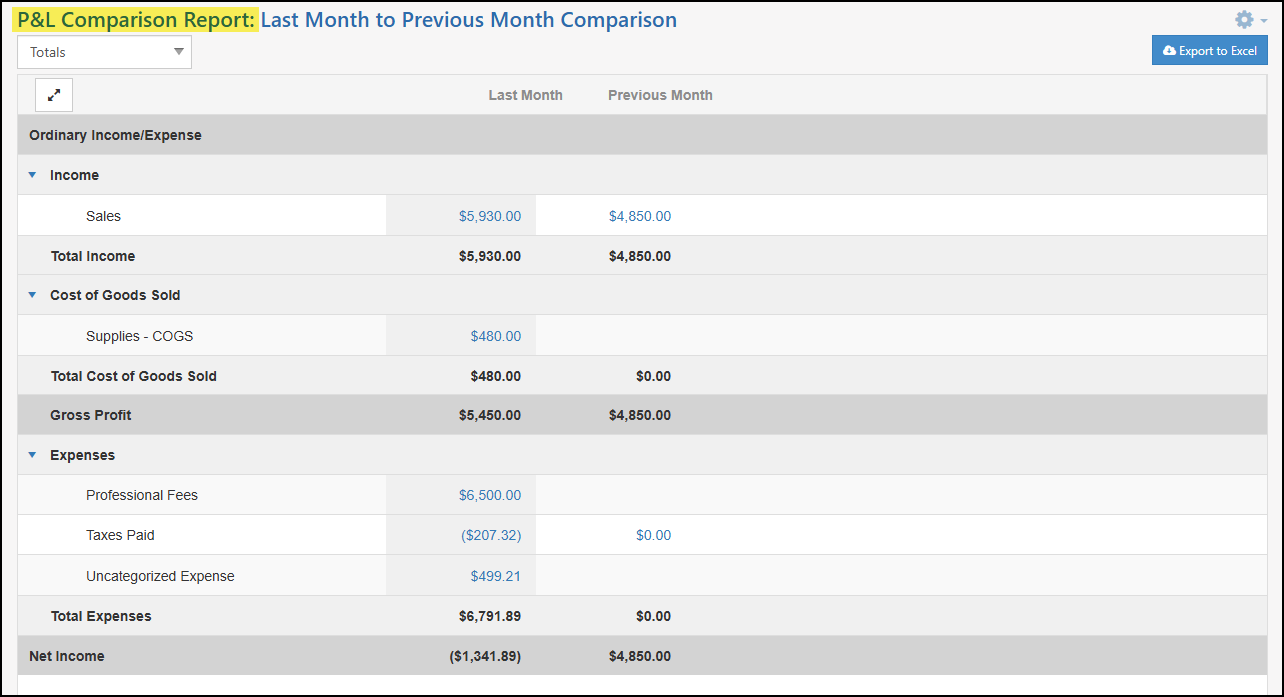
Example of a P&L Comparison Report
Permissions
The following permissions will need to be configured for the Employee’s User Role if they will be managing or viewing P&L Comparison Reports in Striven:
- “P&L Comparison Report – Add/Edit”
- “P&L Comparison Report – View”
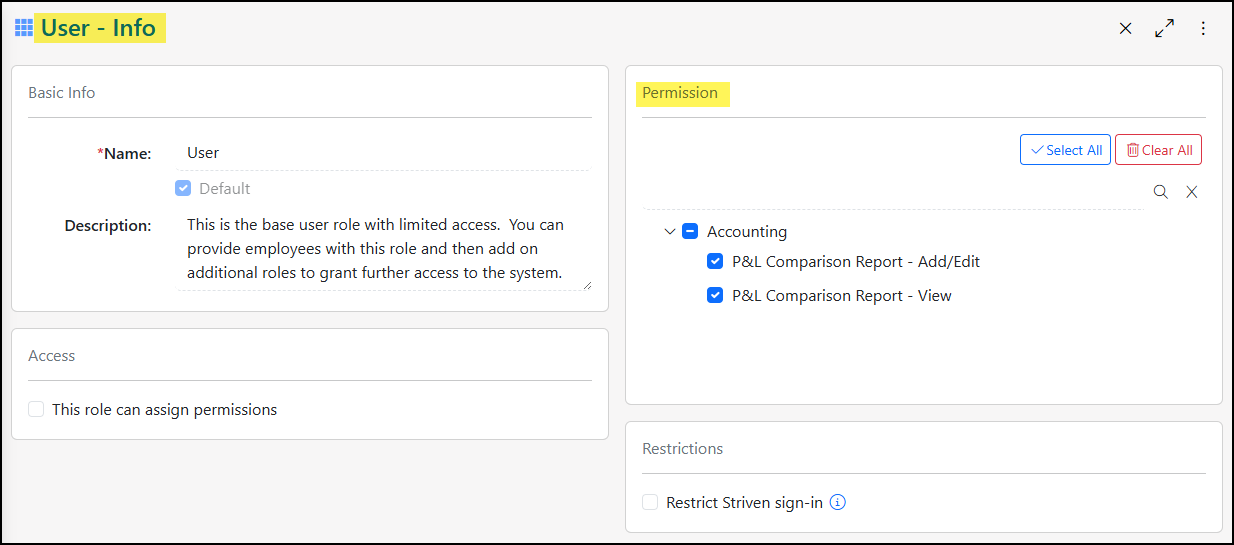
Example of the P&L Comparison Report Permissions
Learn more about managing User Roles and Permissions in Striven by reviewing the User Roles Guide.
P&L Comparison Reports List
To add and manage P&L Comparison Reports, navigate to Reports → Financials → P&L Comparison.
Below is a screenshot illustrating how the P&L Comparison Reports list appears and a description of what can be accomplished there.
- Search Filters: To narrow down results on the P&L Comparison Reports list search filters can be used. Available search filters include the Report Name and the Status.
- Add Report: Will open the configuration options for a new P&L Comparison Report in order to create a new report. Review the next section to learn more about configuration options when adding a new P&L Comparison Report.
- Edit: Will open the configuration options for the existing P&L Comparison Report so changes can be made as needed.
- Run: Opens the existing P&L Comparison Report to view results based on the previous configurations.
- Deactivate: Removes the report from the P&L Comparison Reports list. To reactivate a report, the Status search filter can be changed to Inactive to view previously deactivated reports.
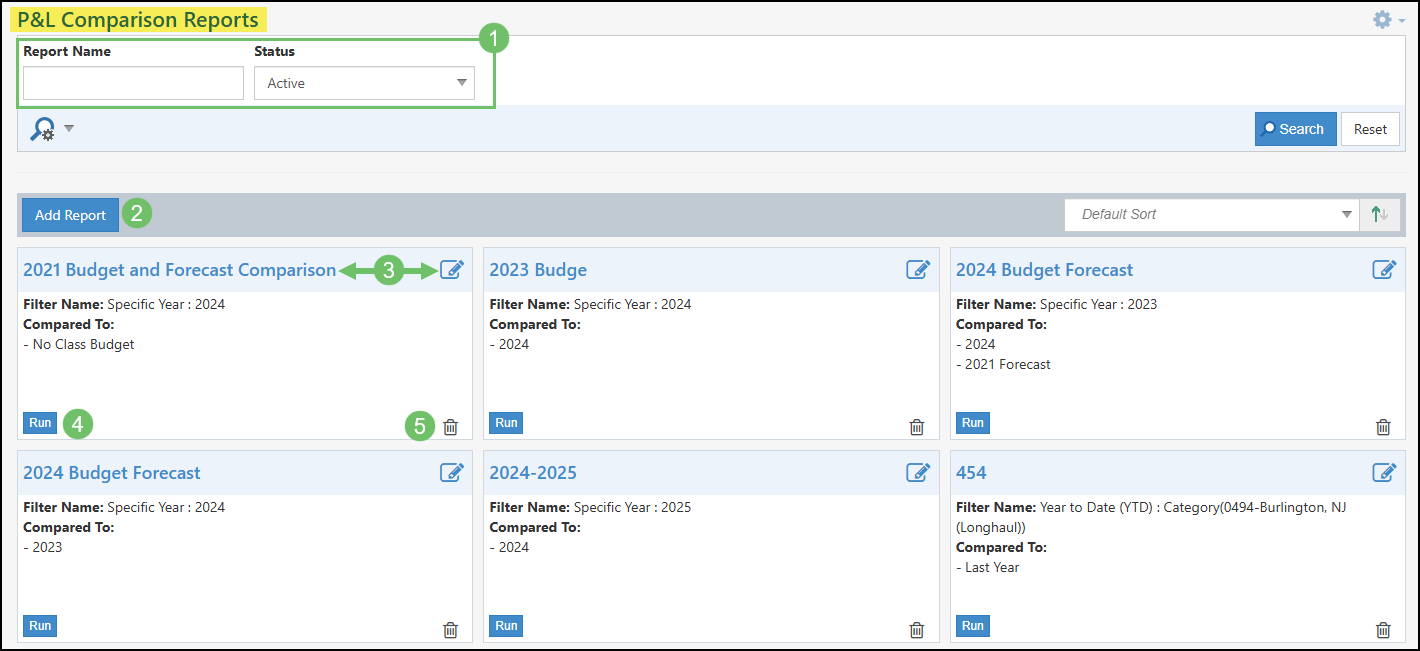
Example of the P&L Comparison Reports List
Adding a P&L Comparison Report
Once you have clicked the Add Report button from the P&L Comparison Reports list, there will be an array of configurations that can be completed in order to customize the P&L Comparison Report based on your needs.
Below is a screenshot of the Add P&L Comparison Report page and what can be accomplished there.
- Report Name: Appears as the report name when viewing in the P&L Comparison Reports list.
- Show Columns: By default, the Show Columns option will be listed as Totals. To have this broken down more by specific time periods when viewing the report, update this field to one of the following options: Week, Month, Quarter, or Year.
- Report Basis: Adjusts the results of the report to be based on either an Accrual or Cash Basis. By default, this setting will be toggled to the Accrual option.
- Time Period: This configuration will set the base data that is going to be compared to in the report. Available time periods include the following:
- Year to Date (YTD)
- Quarter to Date (QTD)
- Month to Date (MTD)
- Week to Date (WTD)
- Last Year
- Last Quarter
- Last Month
- Last Week
- Specific Year
- Specific Quarter/Year
- Specific Month/Year
- Specific Date Range
- Filter Name: This field will default to the Time Period selected but can be updated to display as something else if needed.
- Add Class Filter: Allows the user to select a singular Class in order to adjust the Time Period results to only include financials related to the Class. If selected, the Filter Name field will update to add the Class name at the end.
- Add Comparison: Allows you to add a previous period or a Budget/Forecast in order to compare your Time Period with this selection. More than one comparison can be added to a P&L Comparison Report. Configuration options will be described in more detail in the next section below.
- Comparisons: Lists the previous comparisons that were added to the P&L Comparison Report. Clicking on the comparison name will allow you to edit the comparison. Clicking the Deactivate icon will remove the comparison from the report.
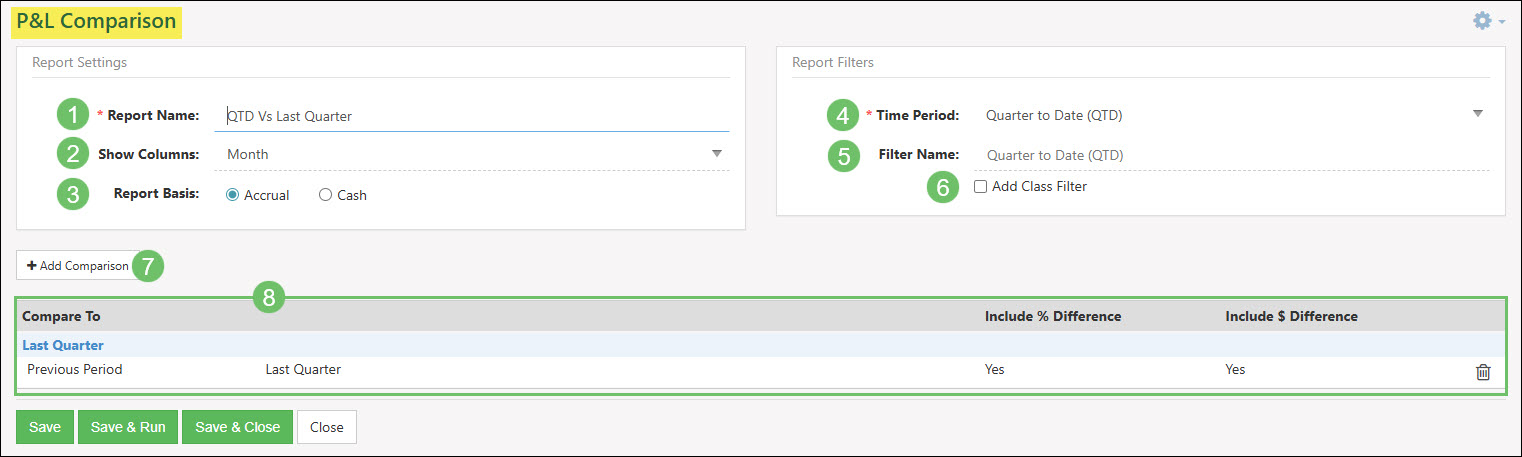
Example of Configuring a P&L Comparison Report
As mentioned above, there are an array of options when adding a comparison to the P&L Comparison Report. To add a comparison to the report, click the Add Comparison button.
Below is a screenshot illustrating how the Comparison dialog window appears and a description of what can be accomplished there.
- Comparison Type: Options include comparing to a Previous Period or a Budget/Forecast. In order to add a comparison including a Budget or Forecast, the Budget/Forecast must be already created in Striven. Learn more about Budgets/Forecasts by reviewing the Budget & Forecast section below.
- Previous Period or Budget/Forecast: Depending on the option you have chosen for the Comparison Type, this field will adjust its available options. If the Previous Period option is selected the available options will adjust depending on what is selected in the Time Period of the P&L Comparison Report.
- Include % and $ Difference: These options will add a separate column in the report to calculate the differences in both a percentage base or dollar amount.
- Filter Name: The Filter Name field will autopopulate depending on the Previous Period selection or Budget/Forecast selection. This can be updated to display as something else if needed.
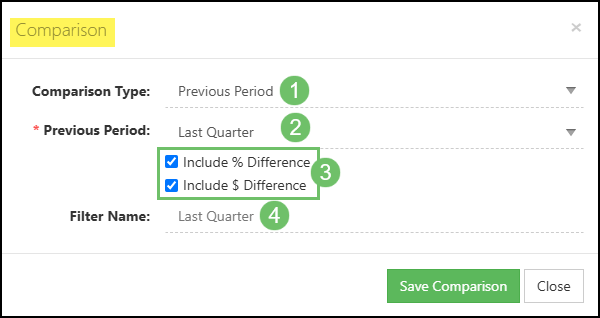
Example of the Add Comparison Configuration Options
Viewing a P&L Comparison Report
Once you have completed your configurations for the P&L Comparison Report the report, running the report will allow you to view the results. The example below has the following configurations:
- Time Period: Quarter to Date
- Show Columns: Month
- Compare To: Last Quarter and Include % and $ Difference
Below is a screenshot of the example P&L Comparison Report and what can be accomplished there.
- Show Columns: Allows you to adjust what type of columns you wish to display in the report. By default, the column selected will be set to what was configured when building the report.
- Full-Screen: Brings the P&L Comparison Report into a full-screen view to easily see more of the report. This option will remove the Striven Menu so only the report results are being viewed.
- GL Accounts: Lists the Income, Cost of Goods Sold, and Expense Accounts being reported on. A calculated row will also be displayed for the Gross Profit (Income – Cost of Goods Sold) and the Net Income (Gross Profit – Total Expenses).
- Report Results: Lists the dollar amounts that are included in the Transactions related to the P&L Comparison Report configurations. Clicking on a hyperlinked number will open a detailed list of the related Transactions.
- Exprot to Excel: Downloads the report results into a .xlsx format in order to view in Excel or other spreadsheet programs.
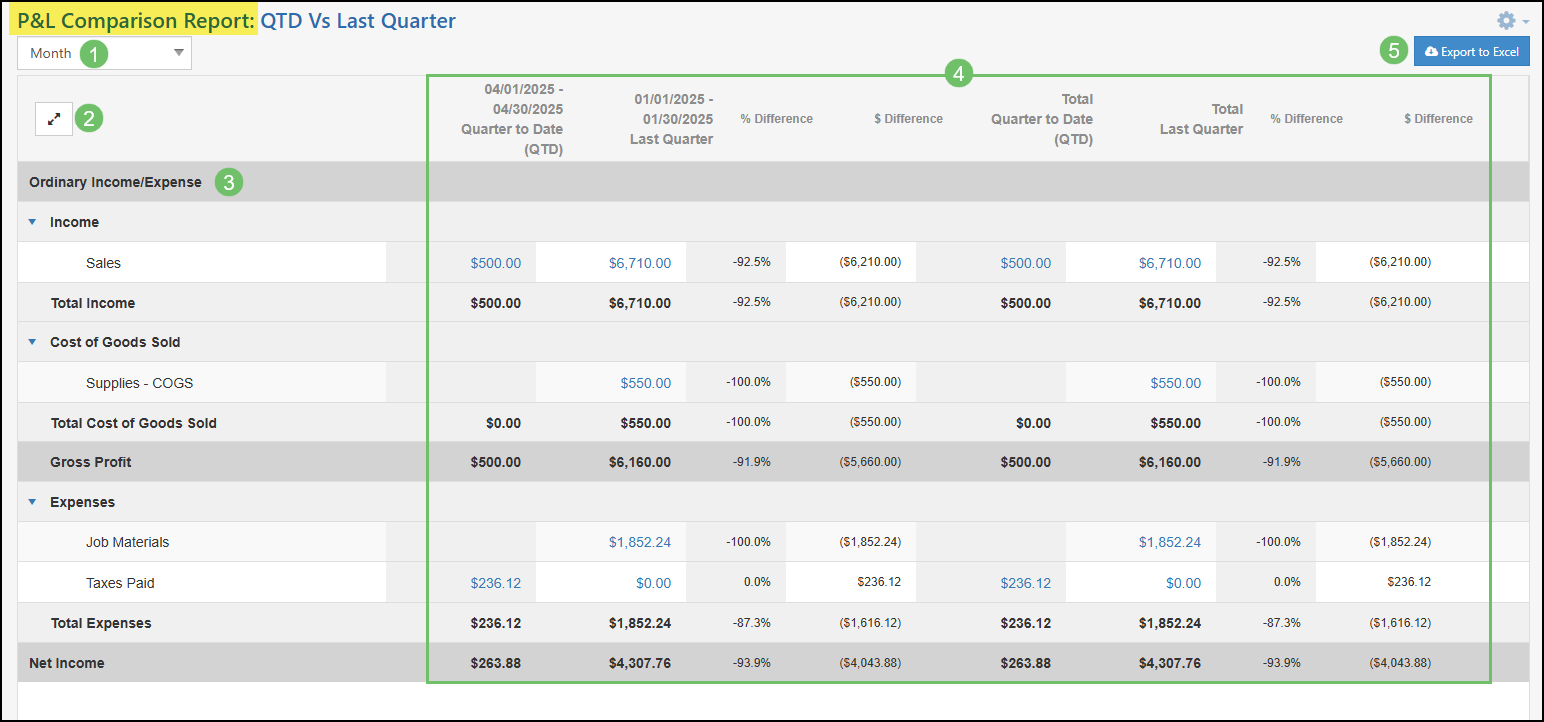
Example of a P&L Comparison Report for QTD vs Last Quarter
-
Customer P&L Comparison Report
The Customer P&L Comparison Report provides the ability to easily identify key financial differences when comparing one time period to another in order to spot significant changes. This report also facilitates the identification of potential changes in profit, such as missing invoices or incorrect reductions in invoice levels, helping you maintain accurate records. Furthermore, it empowers you to recognize and plan for notable trends, allowing for effective resource planning.
Permissions
The following permissions will need to be configured for the Employee’s User Role if they will be managing or viewing P&L Comparison Reports in Striven:
- “Customer P&L Comparison Report – Export” : This permission will be required to export the report to Excel.
- “Customer P&L Comparison Report – View” : This permission will be required in order to view the report in Striven.
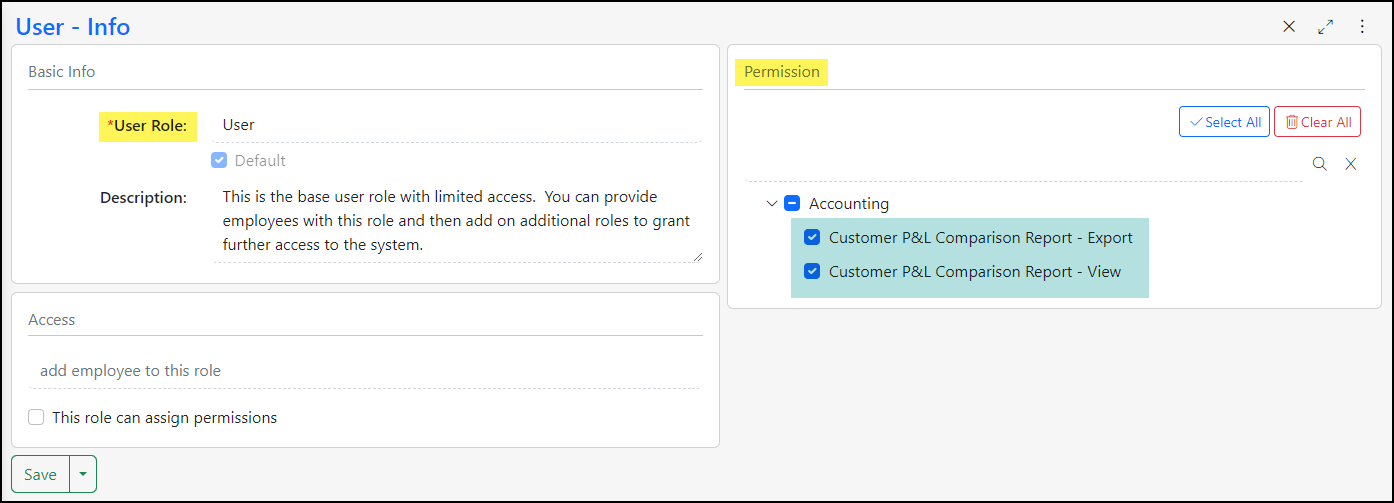
Example of the User Role Permissions Related to the Customer P&L Comparison Report
Learn more about managing User Roles and Permissions in Striven by reviewing the User Roles Guide.
Viewing the Customer P&L Comparison Report
This report can be located by navigating to Reports → Income & Receivables → Customer P&L Comparison.
Here is a description of the variety of elements found on this report:

Example of the Filter and Menu Options on the Customer P&L Comparison Report
- In the top right corner of the page you will find:
- Search (magnifying glass): Shows editable filters to determine which results display in the report.
- Fullscreen Toggle (arrows): Expands the visibility of the page to allow more room to show content and hides page elements, such as the header, menu, and Favorites. Click again to return to the normal view.
- More Menu (kebab): Houses the following options:
- Settings: Displays the permissions needed in your User Role settings to access the information on the page.
- Make Landing Page: Enables you to save this page as your Landing Page in Striven.
- Default Settings: Displays the default search filter settings for the report.
- Sort: Allows you to sort the results by Difference, Difference %, or Customer/Vendor.
- Export: Provides the option to export the report to Excel.
This report comes in two (2) parts: The Summary Report view and the Details Report view. The Summary view will display the report data by using core filters for Date Period and Comparison Date Period, with other filter options included in the Search menu. These include:
     •     Date Range
     •     Comparison Date Range
     •     Item
     •     Item Category
     •     Account
     •     Class
     •     Customer/Vendor
     •     Category
     •     Industry
     •     Primary Assignment
     •     Assignment Category
     •     Assigned To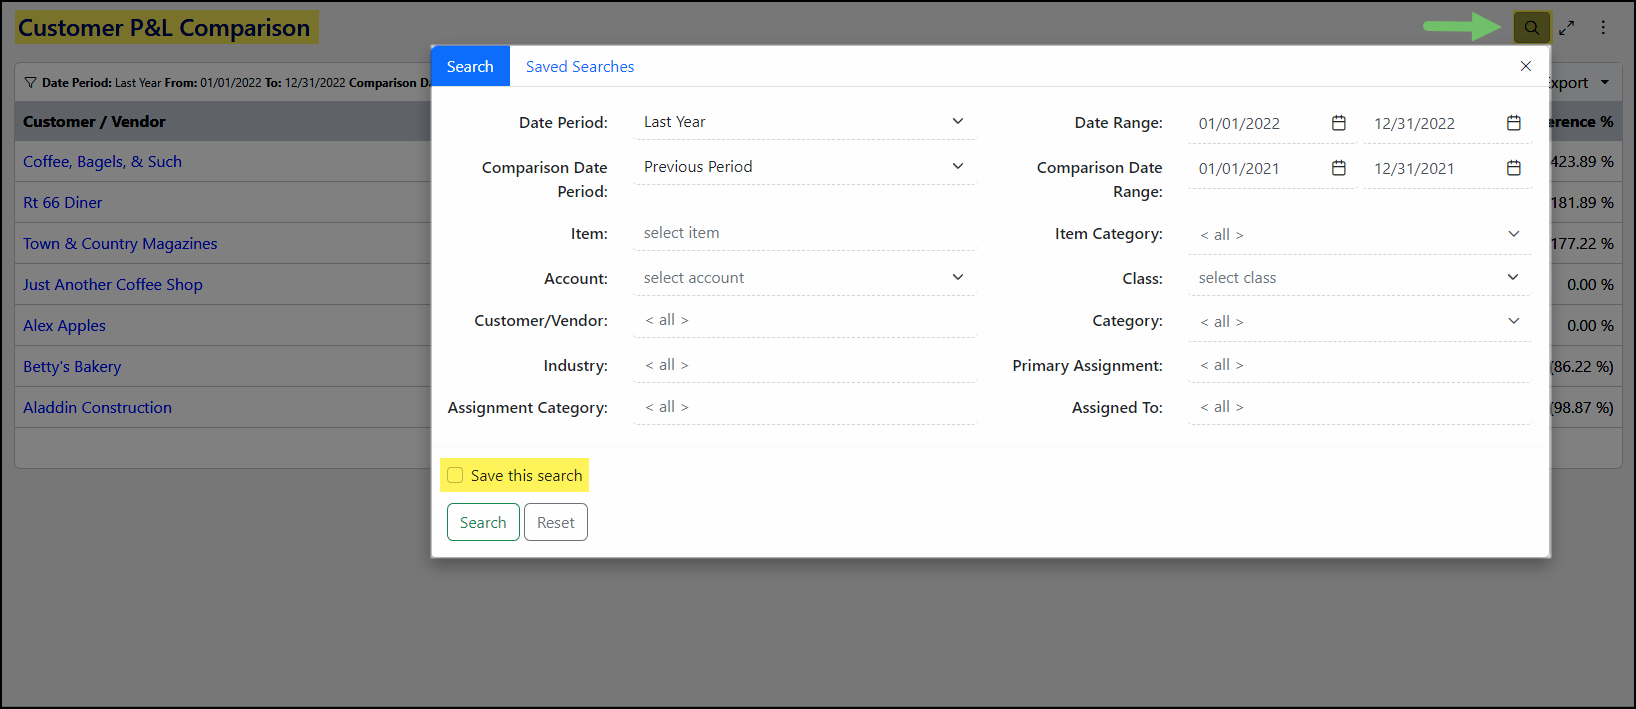
Example of the Available Search Filters for the Customer P&L Comparison Report
Note: This Search menu also offers a Saved Search option to remember your filters for future use.
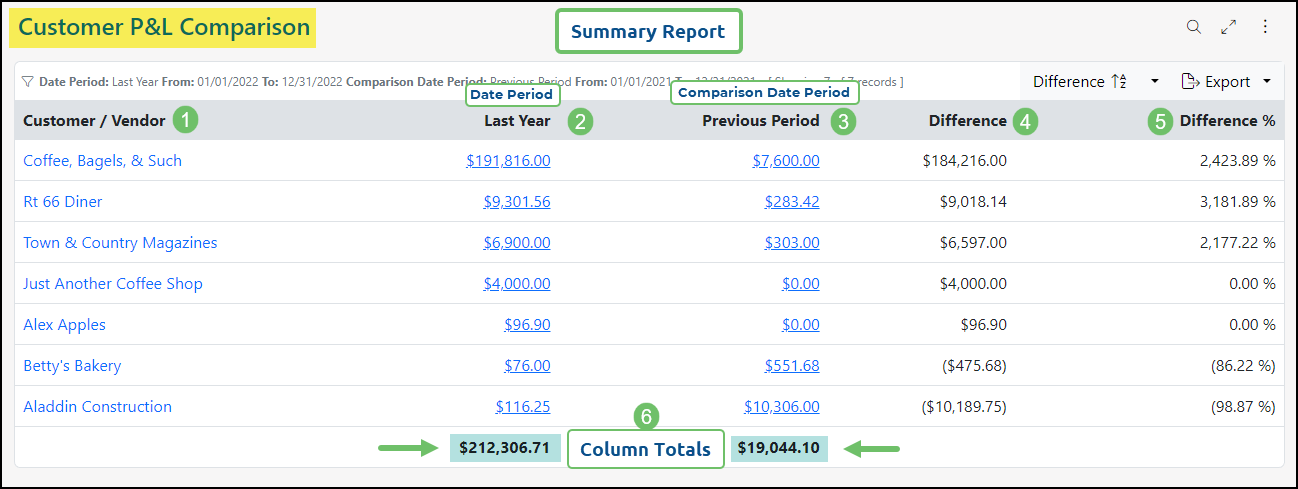
Summary Report View
The Summary Report view will display the following columns:
- Customer/Vendor Name: Displays the name of the Customer/Vendor with a hyperlink to the record in Striven.
- Date Period: Displays the Date Period selected, or Date Range when that filter option is utilized.
- Comparison Period: Displays the Comparison Date Period selected or Comparison Date Range when that filter option is utilized.
- Difference: Displays the profit amount difference between the two (2) periods. This value is obtained by subtracting the Comparison Period amount from the Date Period amount.
- Difference %: Displays the profit percentage difference between the two (2) periods. This value is calculated as the result of subtracting the Comparison Period amount from the Date Period amount, divided by the Comparison Period amount.
- Note: If the Comparison Period amount is zero (0), then the percentage will be displayed as zero (0).
- Column Totals: Displays the totals for all the listed results within the Date Period and Comparison Date Period columns.
- Note: These totals are derived from the Posting Journals for Customer-related transactions that can affect profit, such as Invoices, Credit Memos, and Sales Receipts.
Example of a Customer P&L Comparison Report in Striven
It is important to note that these calculations solely incorporate Postings associated with Income, Expense, and COGS account types, which are categorized as Profit and Loss (P&L) types. All other Postings outside of these categories are not considered in these calculations.
Details Report View
The Details Report view of the Customer P&L Comparison Report can be accessed for each amount listed by clicking on the amount link within the Summary view columns. The link will list all transactions included in the calculation for that amount. You can view these individual transactions by clicking on the hyperlinked values in the Details Report. You can also utilize the Search function on the Details Report to narrow down the results.
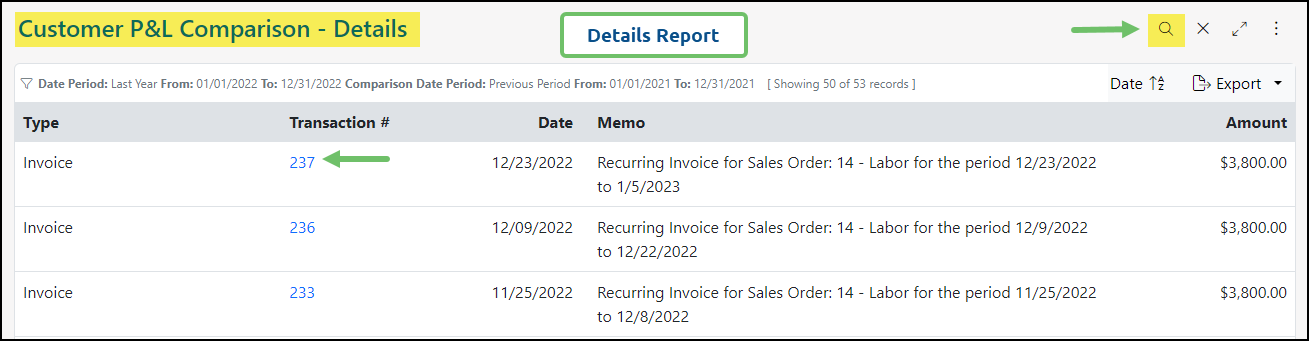
Example of a Details Report View of a Customer P&L Comparison Report
-
Balance Sheet Reports
The Balance Sheet Reports in Striven allows you to ensure your GL Accounts are in balance. This statement will list the asset, liability, and capital of your business at a set point in time which details the balance income over a preceding period. The following Balance Sheet Reports are available in Striven:
- Balance Sheet: The Balance Sheet in Striven allows you to run the report based on an Accrual or Cash basis. Selecting the As Of date will adjust the report accordingly. An option to collapse and expand the report is available in order to quickly see the totals per account type
To run the Balance Sheet Report in Striven, navigate to Reports → Financials → Balance Sheet.
- Balance Sheet by Class: The Balance Sheet by Class allows the same functionality as the Balance Sheet in Striven with the exception of displaying each Class in a separate column in order to view the data per Class.
To run the Balance Sheet by Class Report in Striven, navigate to Reports → Financials → Balance Sheet by Class.
Example of a Balance Sheet Report
-
Balance Sheet
The Balance Sheet Report details a company’s assets, liabilities, and equity at a specific point in time. This report acts as a snapshot of the company’s financial position as of a particular date and can be run in either an Accrual or Cash basis.
Example of the Balance Sheet in Striven
Permissions
The following permissions will need to be configured for the Employee’s User Role if they will be managing or viewing the Balance Sheet Report in Striven:
- “Balance Sheet Report – Export”
- “Balance Sheet Report – View”
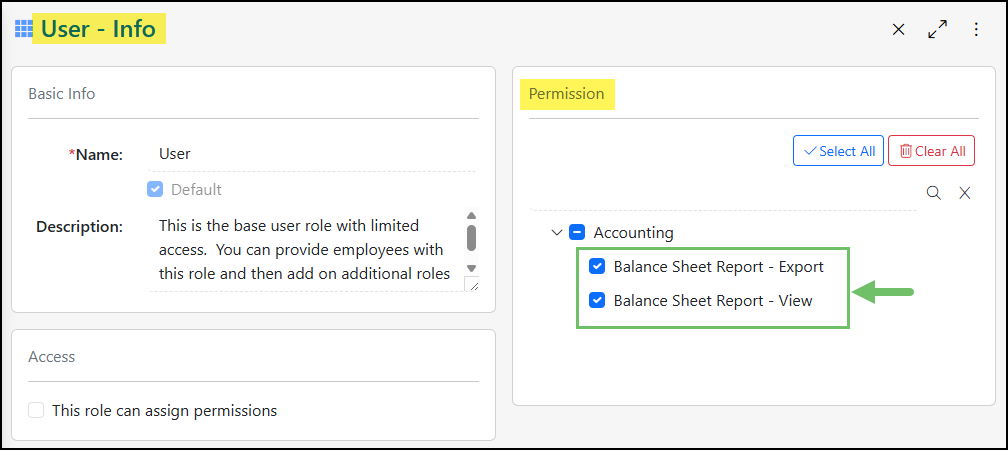
Example of Permissions Related to the Balance Sheet Report
Learn more about managing User Roles and Permissions in Striven by reviewing the User Roles Guide.
Viewing the Balance Sheet Report
To access the Balance Sheet navigate to Reports → Financials → Balance Sheet.
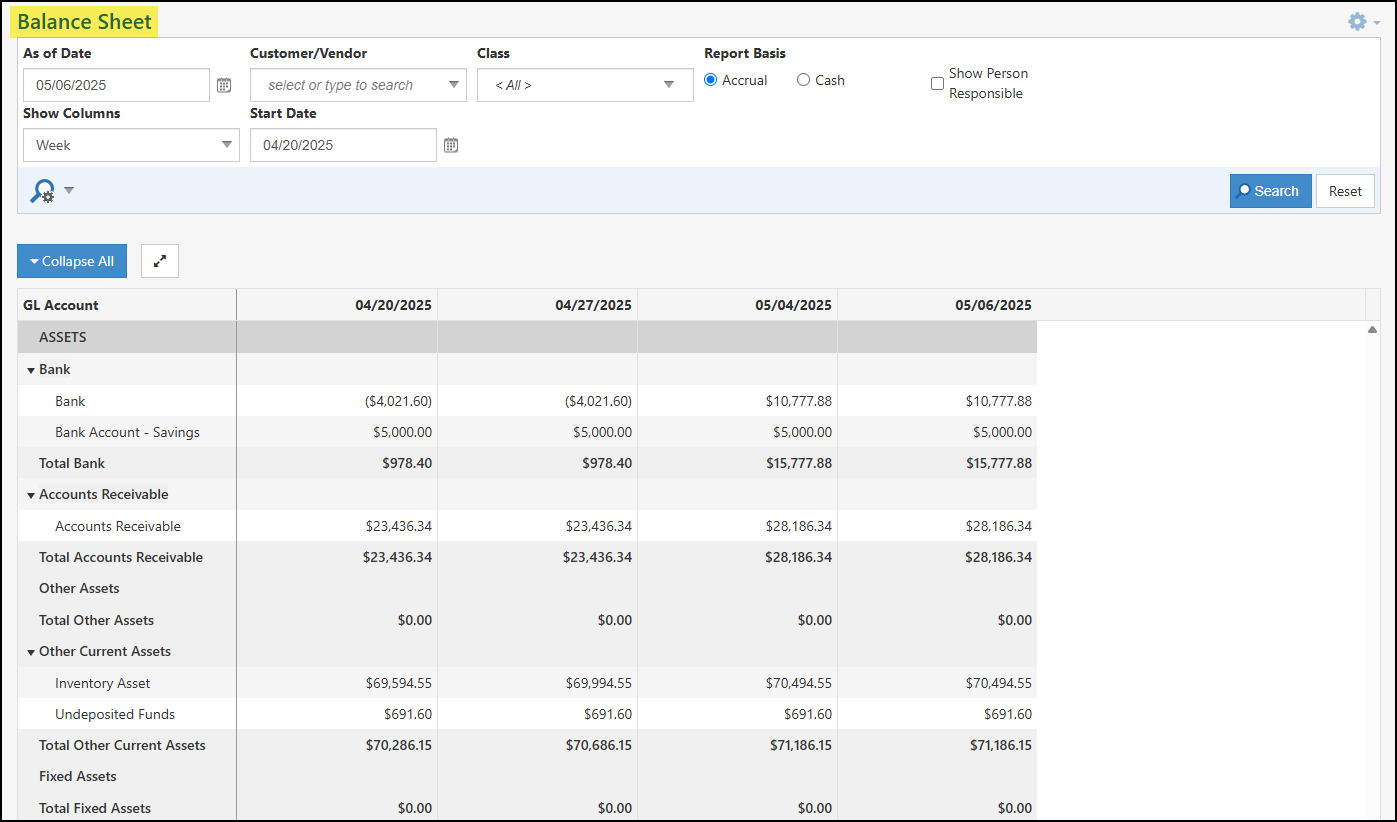
Below is a screenshot illustrating how the Balance Sheet appears and a description of what can be accomplished there.
- As Of Date: Specifies the date for which the Balance Sheet presents the company’s financial position. By default, this field will be set to today’s date.
- Customer/Vendor: Allows you to filter the report down to a single Customer or Vendor related transactions that feed into the Balance Sheet.
- Class: Allows you to multi-select Classes in order to narrow down the Balance Sheet to only transactions related to those Classes. The Balance Sheet By Class Report (which is detailed in the next section of this guide) will set these Classes as separate columns in the report.
- Report Basis: Adjusts the report based on if your Company utilizes the Accrual or Cash Basis for Accounting. Review the Accrual vs Cash section in this guide to learn more about the difference in reporting options.
- Show Person Responsible: Lists the user that is selected in the Person Responsible field when editing a GL Accounts from the Chart of Accounts.
- Show Columns: Adds additional columns to the report based on the Week, Month, Quarter, or Year that falls within your selected date range. Once this option is changed from the default Totals, an additional field for Start Date will be available to determine the date range being reported on.
- Collapse/Expand All: Expands the report so only the totals for each type of GL Account being reported on in the Balance Sheet. By default the report will be expanded, but can easily be collapsed once selected using the same button.
- Full-Screen: Brings the Balance Sheet Report into a full-screen view to easily see more of the report. This option will remove the Striven Menu and the search filters so only the report results are being viewed.
- Report Columns: By default, the Balance Sheet will list the following columns and information:
- GL Account: Lists each GL Account that is being reported on in the Balance Sheet. Balance Sheet GL Accounts include assets, equity, and liability accounts.
- As Of Date: Lists the total calculated amount for each GL Account listed in the Balance Sheet. A line will be added for Total Assets and Total Equity & Liabilities which should both equal the same amount.
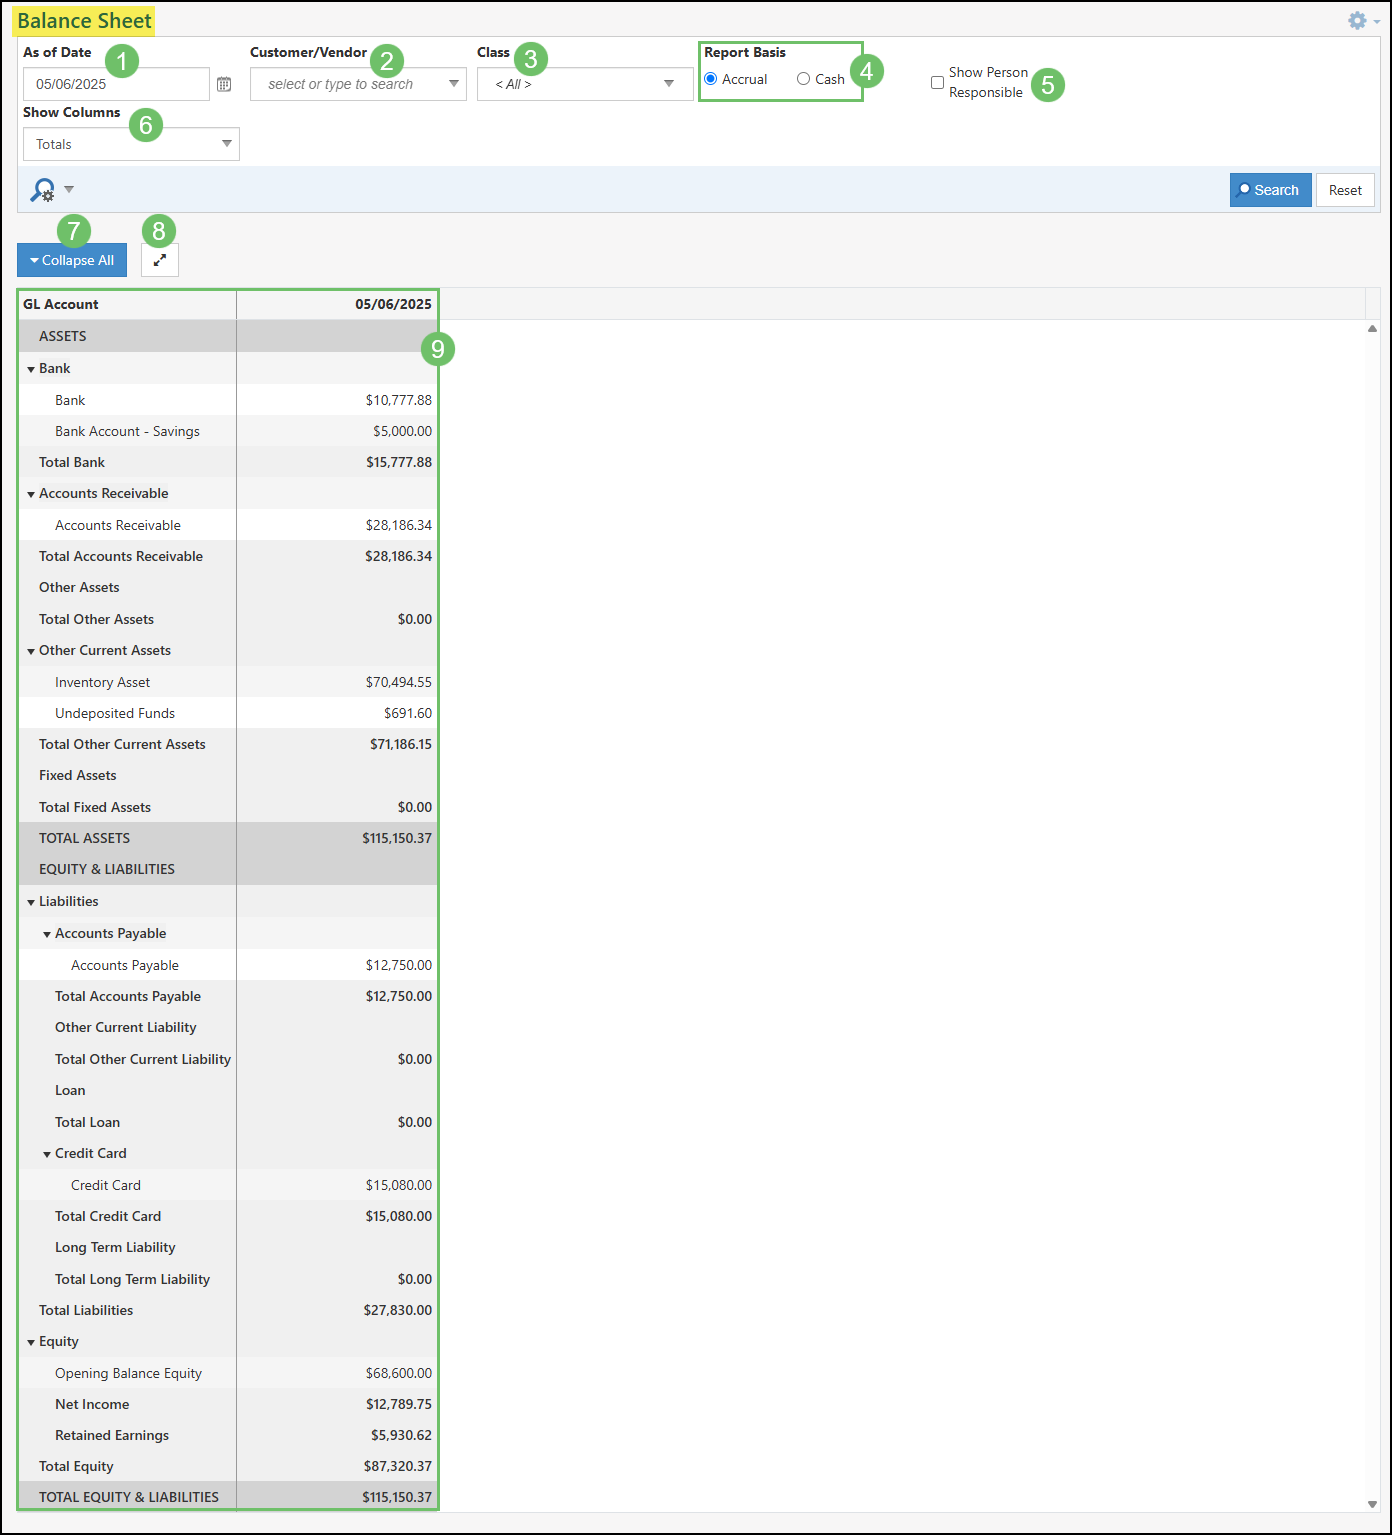
Example of Columns and Filters on the Balance Sheet
Balance Sheet Not Balanced
If the Total Assets do not equal the Total Equity & Liabilities are not equal, a warning will be displayed at the top of the screen when accessing the Balance Sheet which will state Total Assets does not equal Total Equity and Liabilities.

Example of the Out of Balance Warning for Balance Sheets
-
Balance Sheet by Class
The Balance Sheet by Class Report in Striven allows users to view their balance sheet data organized by predefined Classes. Users can filter the report to focus on specific Classes, and this filter selection is saved for future use.
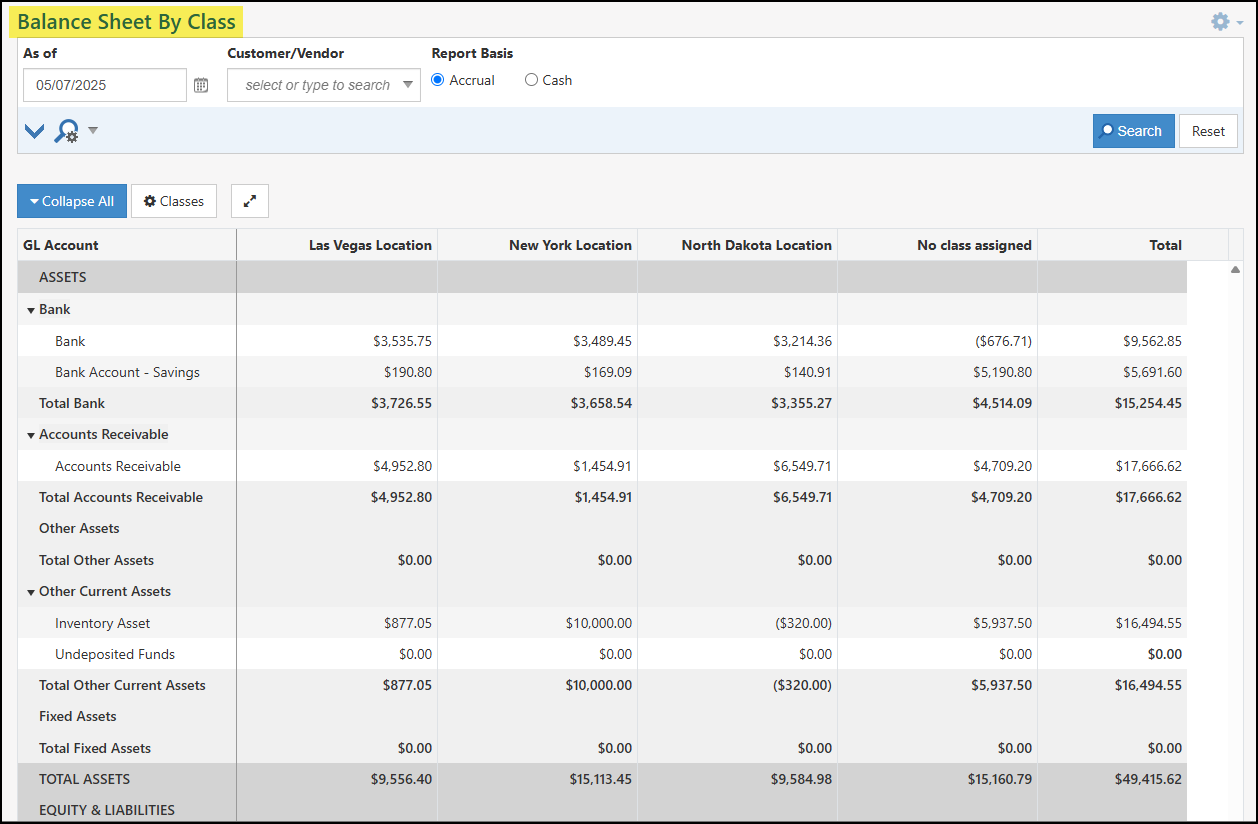
Example of the Balance Sheet by Class Report in Striven
Permissions
The following permissions will need to be configured for the Employee’s User Role if they will be managing or viewing the Balance Sheet Report in Striven:
- “Balance Sheet Report By Class – Export”
- “Balance Sheet Report By Class – View”
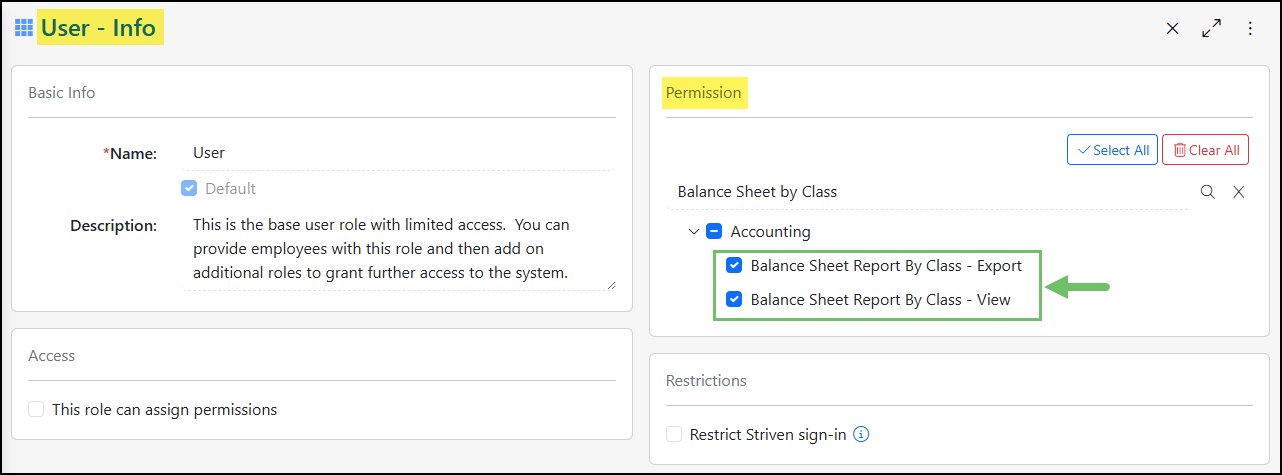
Example of the Permissions Related to the Balance Sheet by Class in a User Role
Learn more about managing User Roles and Permissions in Striven by reviewing the User Roles Guide.
Viewing the Balance Sheet by Class Report
To access the Balance Sheet by Class navigate to Reports → Financials → Balance Sheet by Class.
Below is a screenshot illustrating how the Balance Sheet by Class appears and a description of what can be accomplished there.
- As Of: The Balance Sheet Date indicates the specific date reflecting the company’s financial standing. This field defaults to the current date.
- Customer/Vendor: Filter the Balance Sheet by Class report to view transactions related to a specific Customer or Vendor.
- Report Basis: Adjusts the report based on if your Company utilizes the Accrual or Cash Basis for Accounting. Review the Accrual vs Cash section in this guide to learn more about the difference in reporting options.
- Collapse/Expand All: Expands the report so only the totals for each type of GL Account being reported on in the Balance Sheet by Class. By default the report will be expanded, but can easily be collapsed once selected using the same button.
- Classes: To filter the Balance Sheet by Class report by specific Classes, multi-select the desired Classes. Only transactions associated with the selected Classes will be included in the report; unselected Classes will be excluded. This Class selection will be saved for each user for convenient future access.
- Full-Screen: Brings the Balance Sheet by Class into a full-screen view to easily see more of the report. This option will remove the Striven Menu and the search filters so only the report results are being viewed.
- GL Accounts: Lists each GL Account that is being reported on in the Balance Sheet. Balance Sheet GL Accounts include assets, equity, and liability accounts.
- Class Columns: Lists the total calculated amount for each GL Account per Class listed in the Balance Sheet by Class report. A line will be added for Total Assets and Total Equity & Liabilities which should both equal the same amount.
- No Class Assigned: Lists the total calculated amount for transactions that do not have a Class associated with.
- Total: Totals all the columns that are configured to appear in the report.
- Out of Balance: The red line at the bottom of the report is to indicate if any Classes or the overall total is out of balance. The amount listed will indicate the amount that the Class or total is not in balance.
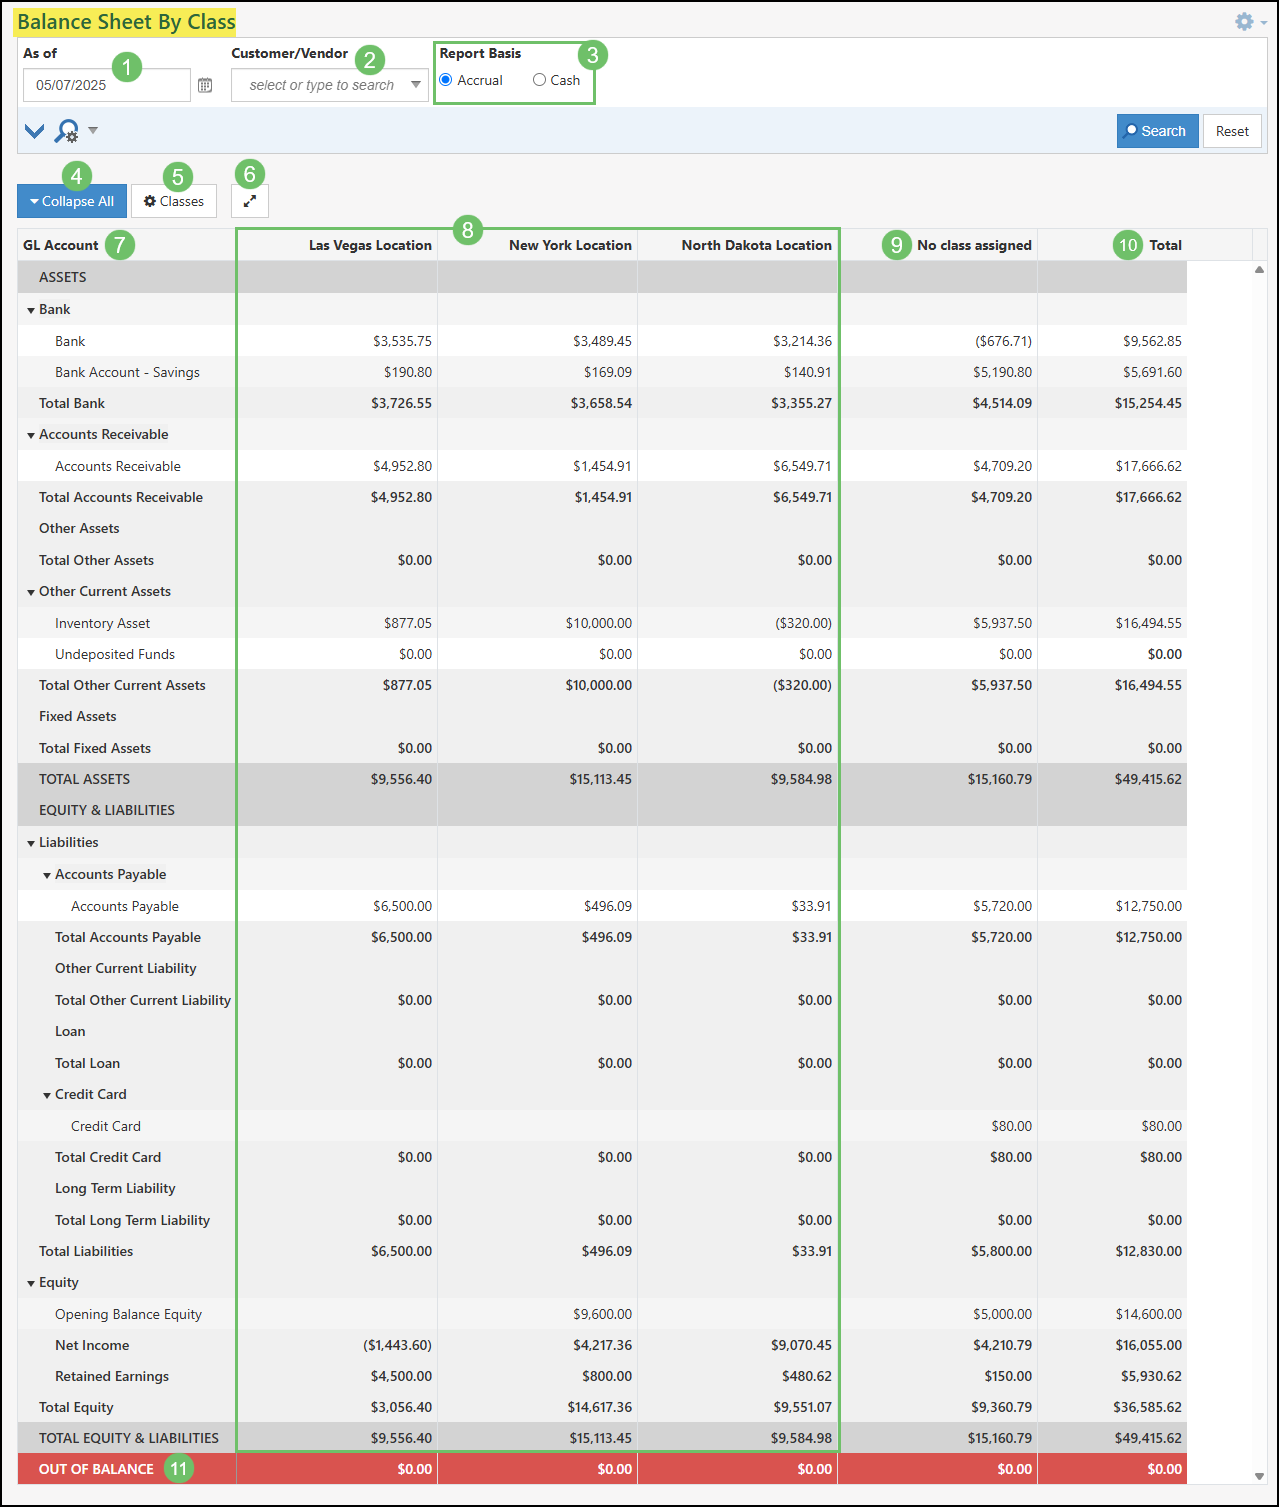
Example of the Columns and Filters in the Balance Sheet by Class
Balance Sheet by Class Not Balanced
If the Total Assets do not equal the Total Equity & Liabilities in the Total column, a warning will be displayed at the top of the screen when accessing the Balance Sheet by Class which will state Total Assets does not equal Total Equity and Liability. If only the Class columns are out of balance and the overall total is still in balance, the warning message will not be displayed.

Example of the Warning Message for the Balance Sheet by Class Being Out of Balance
-
Cash Flow Report
The purpose of this report is to provide a detailed picture of the activity of a company’s cash during a specified period of time, known as the Accounting Period. This information demonstrates your organization’s ability to operate in both the short and long term, based on how much cash is flowing in and out of the business. The data in this report is related to your company’s Statement of Cash Flow.
-
Cash Flow Report Settings
Cash Flow is typically broken down into three (3) sections: Operating, Investing, and Financing activities. By default, Cash Flow is classified into these three (3) sections by Account Type, as follows:
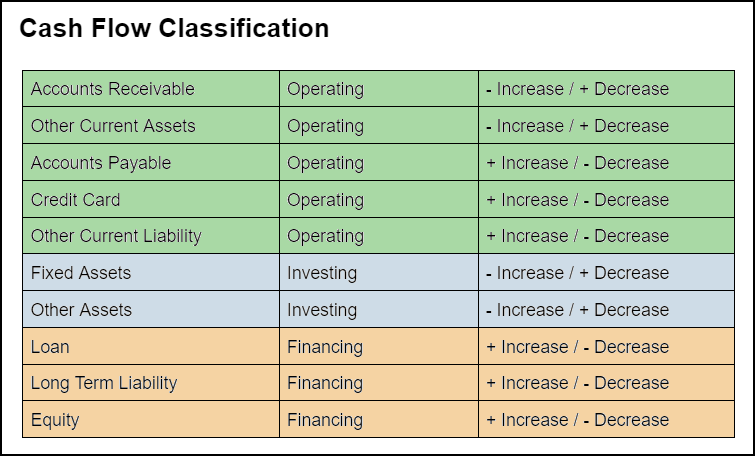
Example of Default Cash Flow Classifications
While these are the default classification settings, you can change the classifications individually for each Account as desired. These settings can be accessed from the Chart of Accounts page by clicking on the Classify Cash button.
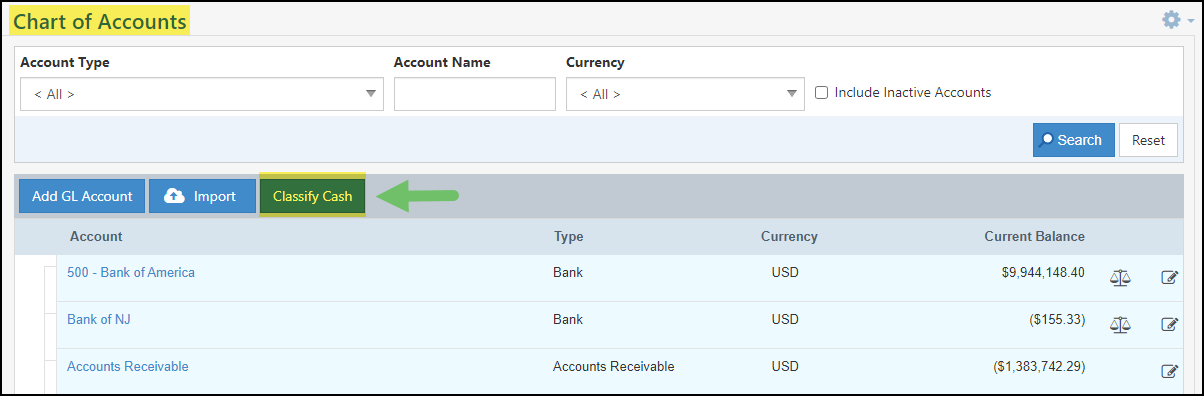
Example of the Classify Cash Button on the Chart of Accounts Page
On the Classify Cash page, you will see the Accounts listed in a TreeView format to visually represent the account hierarchies and their settings. Here is a description of the variety of elements found on this page:
- In the top right corner of the page you will find:
- Search (magnifying glass): Shows editable filters to determine which results display in the list. This includes Type and Account.
- Fullscreen Toggle (arrows): Expands the visibility of the page to allow more room to show content and hides page elements, such as the header, menu, and Favorites. Click again to return to the normal view.
- More Menu (kebab): Houses the Make Landing Page option that enables you to save this page as your Landing Page in Striven.
- Reset to Default: Resets all the listed Account settings back to default.
- Expand All/Collapse All: Enables you to view the list with all the nested Accounts showing or hidden depending on the selected view.
- Account: Displays the Account Name.
- Type: Displays the Account Type.
- Activity: Displays the Cash Flow Activity Type.
- Increase/Decrease: Displays whether a positive/negative number represents an Increase/Decrease for the Account.
- Edit: Allows you to configure the settings for the Activity Type and Increase/Decrease options.
- Customized Label: Displays when the Account Settings have been changed from the default settings.
The highlighted area of the image shows examples of nested Accounts and how they can appear on the list.
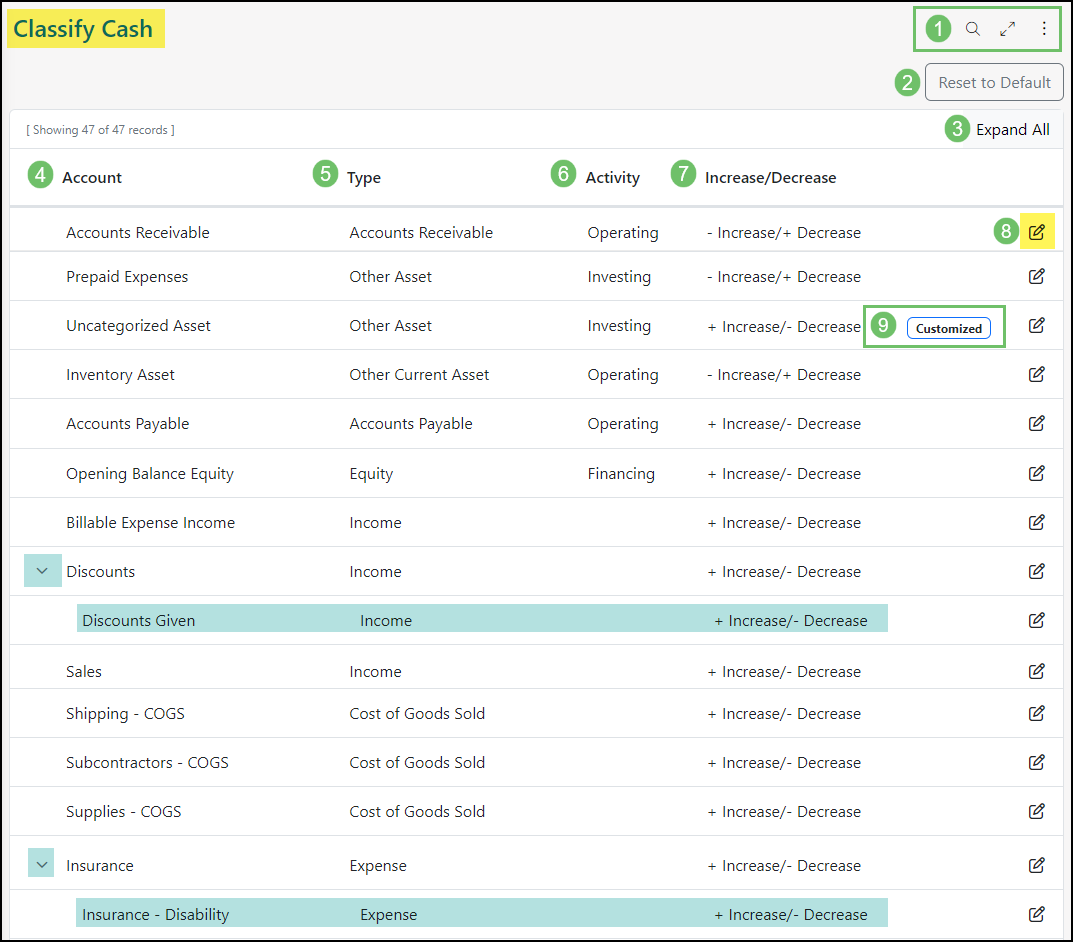
Example of the Classify Cash Page
Permissions
The following permissions will need to be configured for the Employee’s User Role if they will be utilizing the Cash Flow Report in Striven:
- “Cash Flow Report – Export”
- “Cash Flow Report – View”
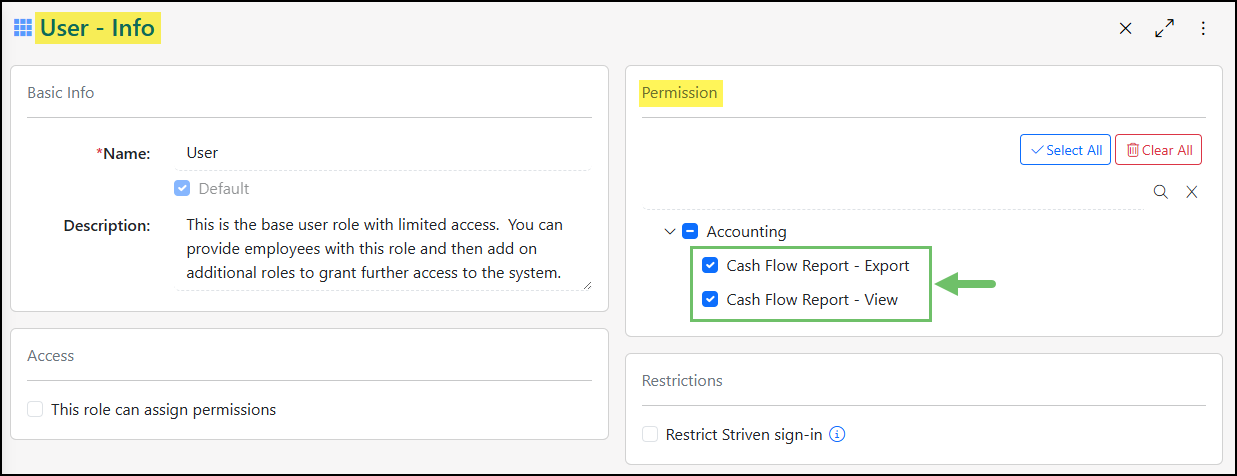
Example of the Cash Flow Report Related Permissions
Learn more about managing User Roles and Permissions in Striven by reviewing the User Roles Guide.
- In the top right corner of the page you will find:
-
Understanding the Cash Flow Report
To view the Cash Flow Report, navigate to Reports → Financials → Cash Flow.
Here is a description of the variety of elements found on this report:
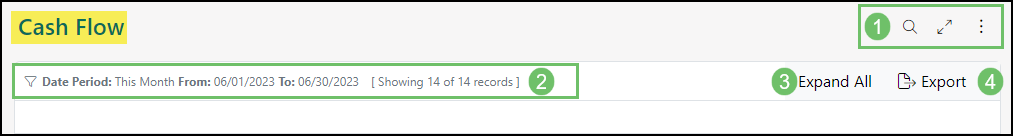
Example of the Filter and Menu Options on the Cash Flow Report
- In the top right corner of the page you will find:
- Search (magnifying glass): Shows editable filters to determine which results display in the list. This includes Type and Account.
- Fullscreen Toggle (arrows): Expands the visibility of the page to allow more room to show content and hides page elements, such as the header, menu, and Favorites. Click again to return to the normal view.
- More Menu (kebab): Houses the following options:
- Settings: Displays the permissions needed in your User Role settings to access the information on the page.
- Make Landing Page Enables you to save this page as your Landing Page in Striven.
- Default Settings: Displays the default search filter settings for the report. The page will automatically display the Date Period for This Month, but this can be edited using the Search option. Alternative filter options include:
- Date Range: Allows you to filter the report for data between selected dates.
- Class: Allows you to filter the results by Class, if applicable.
- Expand All/Collapse All: Enables you to view the report results for each Activity with the nested Accounts showing or hidden depending on the selected view.
- Export: Provides the option to export the report as a PDF file.
The report results are separated into the same three (3) Activity sections as mentioned previously. To determine the values for these accounts, Striven pulls the values from the beginning and end of the period and calculates the difference. Depending on whether the computed amount is positive or negative, and based on the specified settings (i.e. whether a negative indicates an increase and positive indicates a decrease, or vice versa), the report will display a positive or negative amount accordingly.
- Operating Activities: This section lists the Accounts related to the cash flow activities of your company’s core operations, including Customer payments, cost of production, and Employee payroll.
- Net Income will be the initial entry under the Operating Activities section of the report. This will display the result of revenues, minus the expenses, taxes, and COGS.
- Cash Flow from Operating Activities: This row shows the total cash flow for all of the listed Operating Activities Accounts above it.
- Investing Activities: This section shows the Accounts related to cash generated or spent relating to investment activities, such as the purchase of physical assets, investments in or sales of securities, or loan payments to suppliers.
- Cash Flow from Investing Activities: This row shows the total cash flow for all of the listed Investing Activities Accounts above it.
- Financing Activities: This section shows the net amount of funding a company raises and repays through debt financing (conventional loans), equity financing (capital in exchange for business ownership percentages), or dividend payments.
- Cash Flow from Financing Activities: This row shows the total cash flow for all of the listed Financing Activities Accounts above it.
- Net Cash (from Activities): This row will display the sum of the Cash Flow for all three Activity sections.
- Cash at Beginning/End of Period: These rows display the totals calculated for all bank accounts, plus the Undeposited Funds Account.
- Net Cash (from the Period): This row shows the difference between the Cash at Beginning of Period and the Cash at End of Period rows.
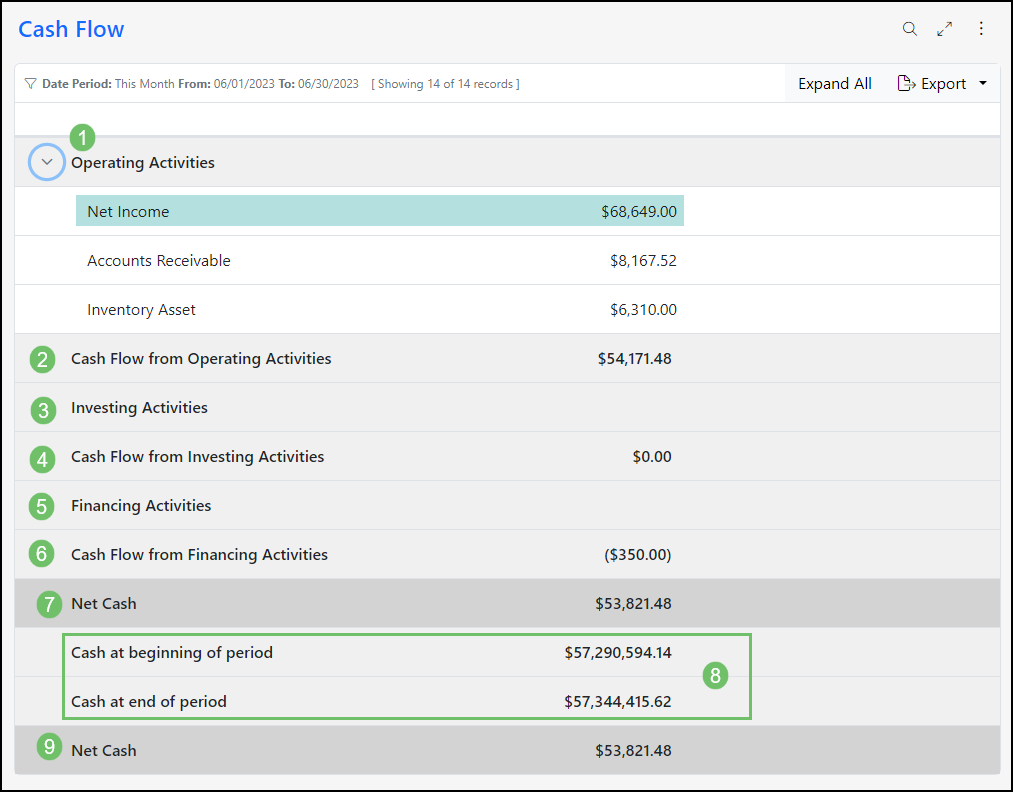
Example of a Cash Flow Report in Striven
- In the top right corner of the page you will find:
-
Trial Balance Report
The Trial Balance Report is a key accounting tool that verifies the equality of debit and credit balances in a company’s General Ledger at a specific time. It lists all ledger accounts and their balances to detect mathematical errors in recording financial transactions, ensuring the accounting equation remains balanced. Discrepancies require investigation to maintain accurate financial records.
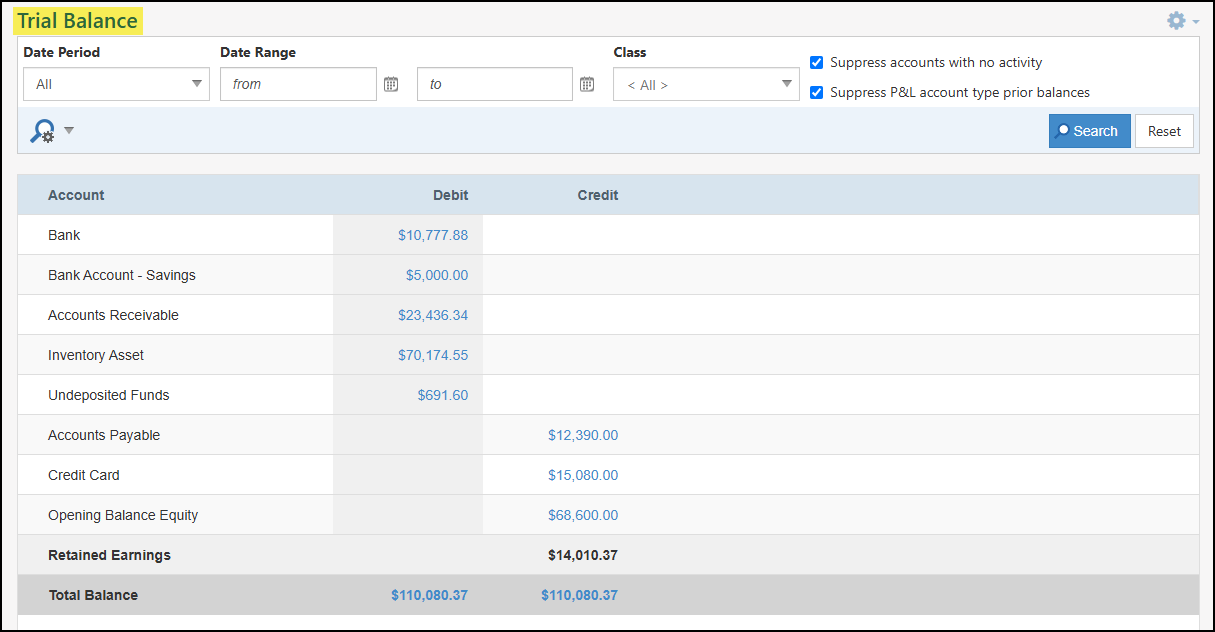
Example of the Trial Balance Report
Permissions
The following permissions will need to be configured for the Employee’s User Role if they will be utilizing the Trial Balance Report in Striven:
- “Trial Balance – Export”
- “Trial Balance – View”
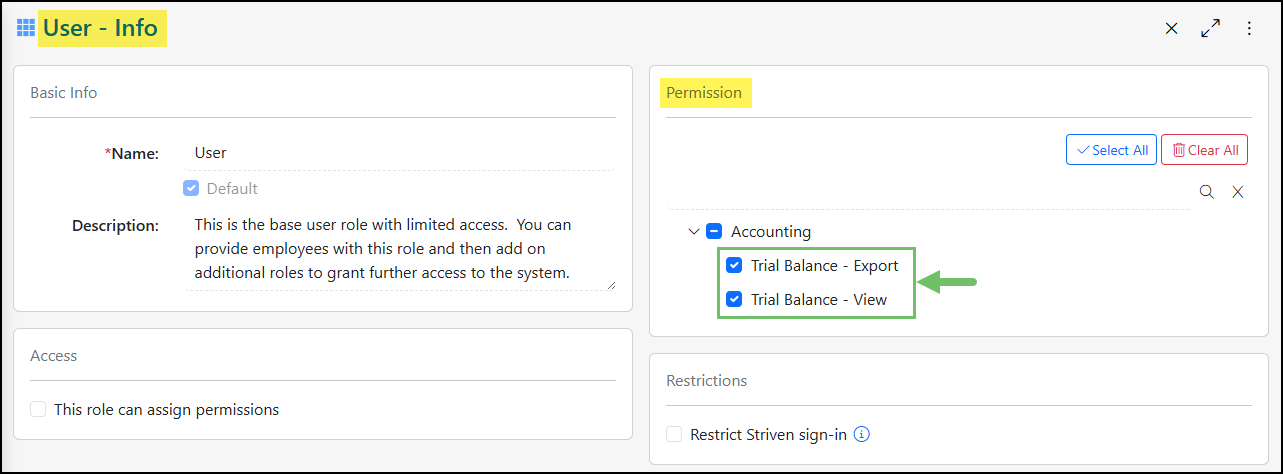
Example of the Trial Balance Related Permissions
Learn more about managing User Roles and Permissions in Striven by reviewing the User Roles Guide.
Viewing the Trial Balance Report
To access the Trial Balance Report navigate to Reports → Financials → Trial Balance.
Below is a screenshot illustrating how the Trial Balance Report appears and a description of what can be accomplished there.
- Date Period/Range: Adjusts the amounts listed in the Debit and Credit columns based on the specific date period or range selected here.
- Class: Adjusts the amounts listed in the Debit and Credit columns based on the related Transactions that have the selected Class set.
- Suppress Options: Configuration options to suppress certain information in the Trial Balance. By default these two options are toggled on:
- Suppress Accounts With No Activity: Will remove any GL Accounts from the Trial Balance that do not have any activity within the selected date period or range.
- Suppress P&L Account Type Prior Balances: Sets prior balances into a Retained Earnings earnings account.
- Account: Lists the GL Accounts that are being reported on in the Trial Balance Report.
- Debit/Credit: Lists the amounts of each GL Account and whether the account is currently in a Credit or Debit status. A running total for both columns will be listed at the bottom with the goal of them being equal. Clicking on an amount listed will open a detailed list of the related Transactions for more information.
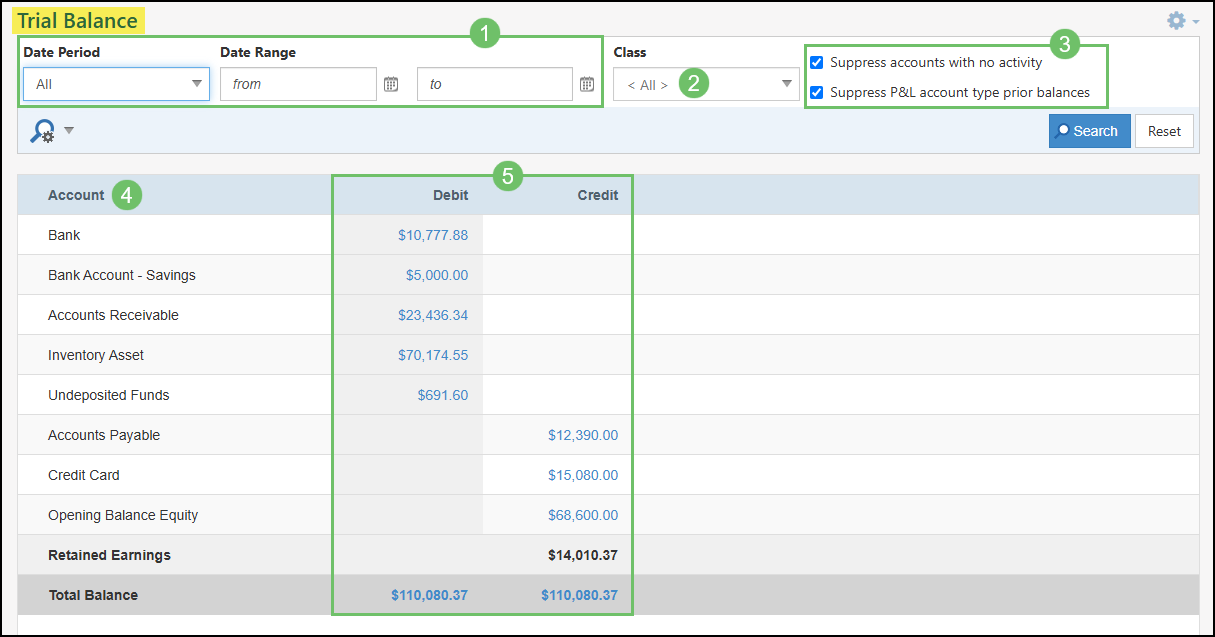
Example of Running the Trial Balance Report
Trial Balance Detail
The Detail view of the Trial Balance can be viewed by clicking on an amount listed in the Debit or Credit columns to view the Transactions that are behind the total listed. The only total listed that is unable to view the details would be the Retained Earnings as this is a calculated field.
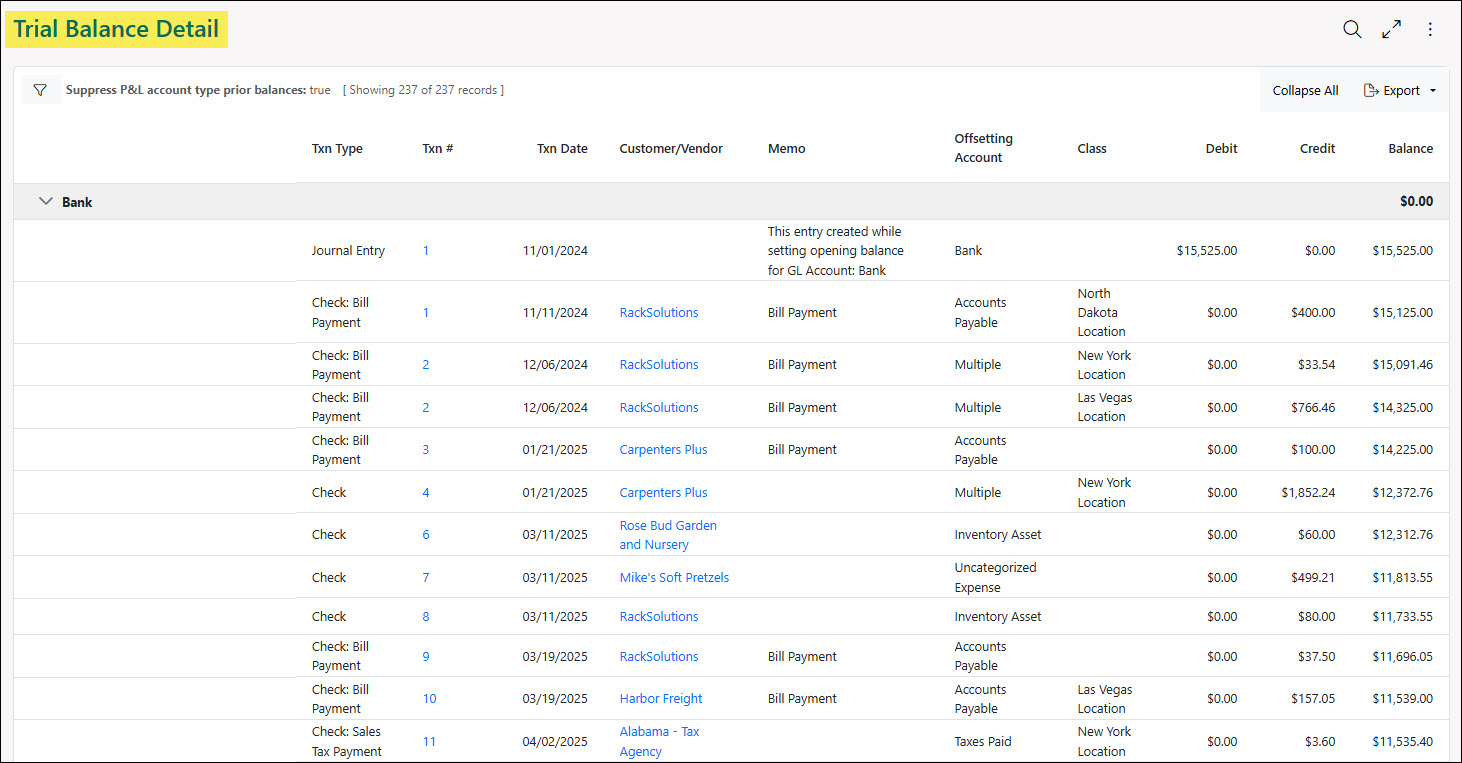
Example of the Trial Balance Detail
Below is a screenshot illustrating how the Trial Balance Detail appears and a description of what can be accomplished there.
- Search Filters: Search filters that were set on the Trial Balance will carry over when viewing the Trial Balance Detail. Search filters for the Trial Balance Detail include the following:
- Date Range: Will only include the Transactions in the Trial Balance Detail based on the date set on the Transaction within the selected date range.
- Class: Will only include Transactions in the report based on the Class selected on the related Transaction.
- Account: When viewing the Trial Balance Detail the search filter for Account will be prefiltered to only include the GL Account where the Detail version of the report was accessed. Accessing the Trial Balance Detail by clicking on the Debit or Credit Total Balance at the bottom of the Trial Balance will not filter for a specific GL Account.
- Suppress P&L Account Type Prior Balances: Will exclude any beginning or opening balances for Profit and Loss type accounts, such as revenue and expense accounts, from previous accounting periods.
- Suppress Accounts With No Activity: Will remove any GL Accounts from the Trial Balance that do not have any activity within the selected date period or range. This is useful if selecting a parent GL Account to view and the child GL Accounts do not have any activity and should be excluded from the Details view of the Trial Balance.
- Collapse/Expand All: By default, each GL Account listed will have their section expanded to show the Transactions that are included in the report. Using this option, the report can be collapsed to hide the Transactions and only view the Balance column for each GL Account included in the Trial Balance Detail.
- Export: Will export the Trial Balance Detail in order to view in Excel or other spreadsheet programs.
- GL Account: Lists the GL Account that is included in the Trial Balance Detail. Each GL Account will have Transactions listed in order to view the details making up the total balance.
- Transaction Type: Displays the type of Transaction that is being included in the report.
- Transaction #: A hyperlink of the Transaction number in order to access the related Transaction to view in more detail.
- Transaction Date: Shows the date that is set on the related Transaction.
- Customer/Vendor: A hyperlink of the Customer or Vendor that is set on the related Transaction. Clicking on the Customer/Vendor name will open their profile to view more details.
- Memo: Displays the memo that was added to the related Transaction.
- Offsetting Account: Shows the GL Account that is being used as the offsetting account.
- Class: If a Class is set on the related Transaction, it will be displayed in this column.
- Debit: Lists the amount from the related Transaction that is being Debited.
- Credit: Lists the amount from the related Transaction that is being Credited.
- Balance: Each GL Account included in the Trial Balance Detail will show the beginning balance and then a running balance for each Transaction that is included in the report. At the bottom of each GL Account section, the ending balance will be displayed based on the Transactions being included in the report.
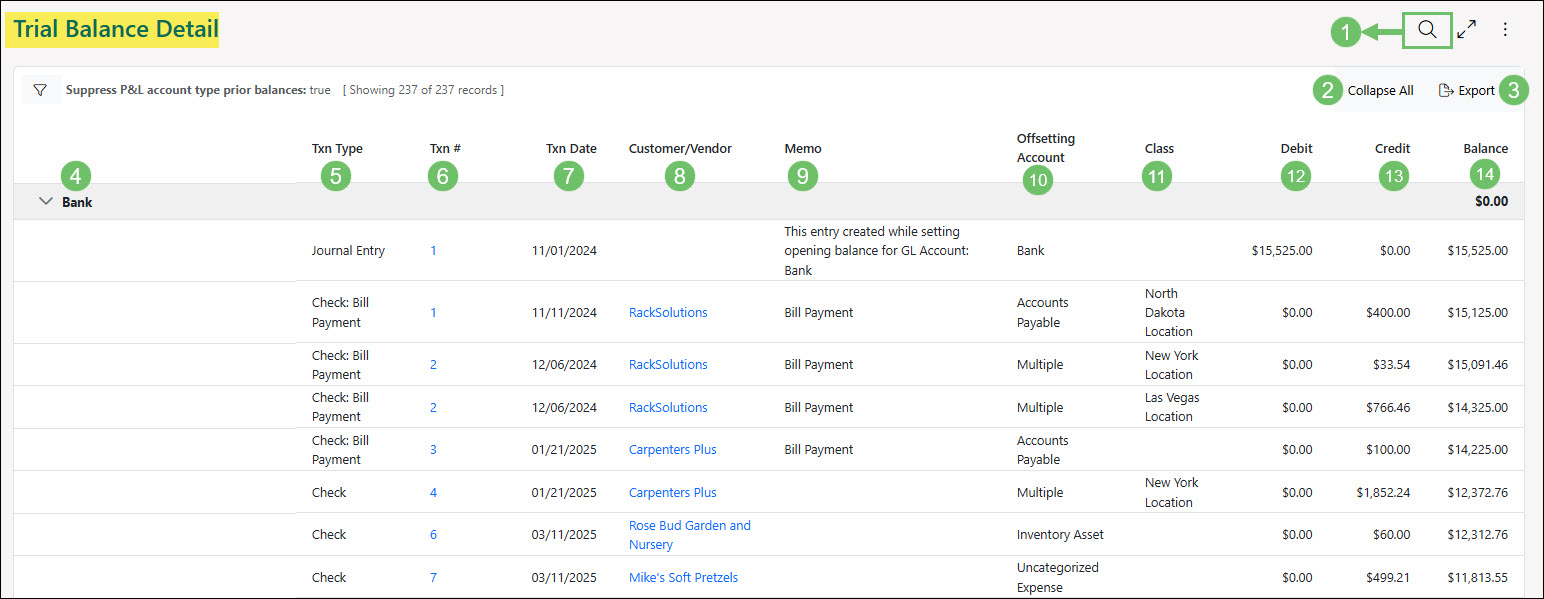
Example of the Information Available on the Trial Balance Detail
-
Transaction History Audit Trail
The Transaction History Audit Trail offers a comprehensive view of all modifications made to Transactions, providing a chronological record of changes over time. This feature is invaluable for understanding how Transactions have evolved, identifying who made specific alterations, and when those changes occurred. By tracking every adjustment, the audit trail enhances transparency and accountability within the system. It serves as a powerful tool for troubleshooting discrepancies and ensuring data integrity. Users can leverage this audit trail to investigate past actions and compare different versions of a Transaction.
To access the Transaction History Audit Trail, navigate to Reports → Financials → Audit Trail.
Example of the Transaction History Audit Trail Report
Permissions
The following permissions will need to be configured for the Employee’s User Role if they will be managing or viewing the Transaction History Audit Trail Report in Striven:
- “Transaction Audit Trail”
- “Transaction Audit Trail – Export”

Example of Permissions Related to the Transaction History Audit Trail Report
Learn more about managing User Roles and Permissions in Striven by reviewing the User Roles Guide.
-
Transaction History Audit Trail Search Filters
The Transaction History Audit Trail Report offers a wide array of search filters designed to help users pinpoint the specific transactions they need to examine for modifications. The availability of multiple filtering options ensures a granular level of control over the displayed transaction history, supporting various audit objectives and analytical needs.
Below is a screenshot illustrating the search filters available for the Transaction History Audit Log Report and a description of what can be accomplished there.
- Transaction #: Narrows down the results in the Transaction History Audit Log based on the Transaction number.
- Modified Date Range: Will list results based on when the modification to the Transaction took place. A from and to date can be selected in order to base these results on a range of days.
- Modified By: Shows results based on the Employee who made the modification to the Transaction.
- Customer/Vendor: Narrows results based on the Customer or Vendor that is associated with the Transaction.
- Type: Lists results based on the type of transaction.
- Transaction Date Range: Will list the results based on the date that is listed on the Transaction. A from and to date can be selected in order to base these results on a range of days.
- Reviewed By: Narrows the search results based on the Employee who completed the review of the Transaction through the Transaction Review Queue.
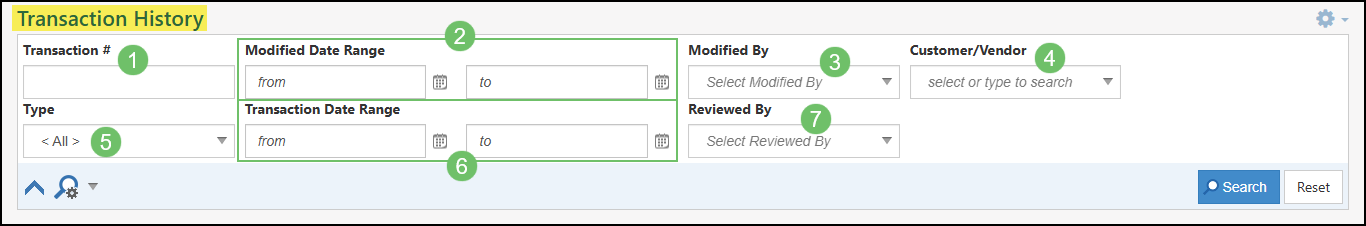
Example of the Search Filters on the Transaction History Audit Log Report
-
Viewing the Transaction History Audit Trail Report
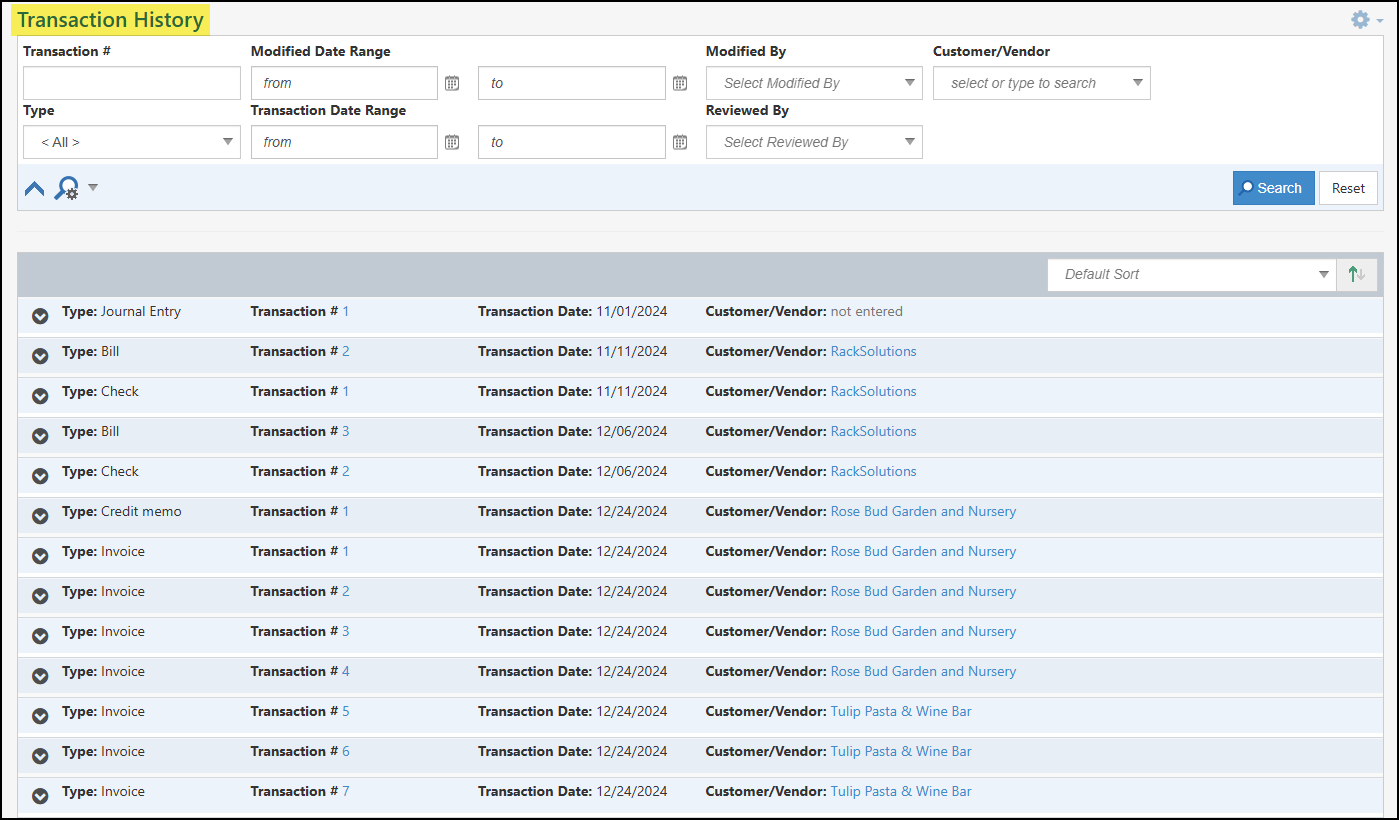
The Transaction History Audit Trail Report provides a detailed, auditable history of all modifications to specific transactions. It tracks who changed what and when, enabling users to understand a transaction’s evolution, identify discrepancies, ensure data integrity, meet regulations, and gain insights into the transaction lifecycle. This comprehensive report facilitates monitoring and analysis, fostering accountability and informed decisions.
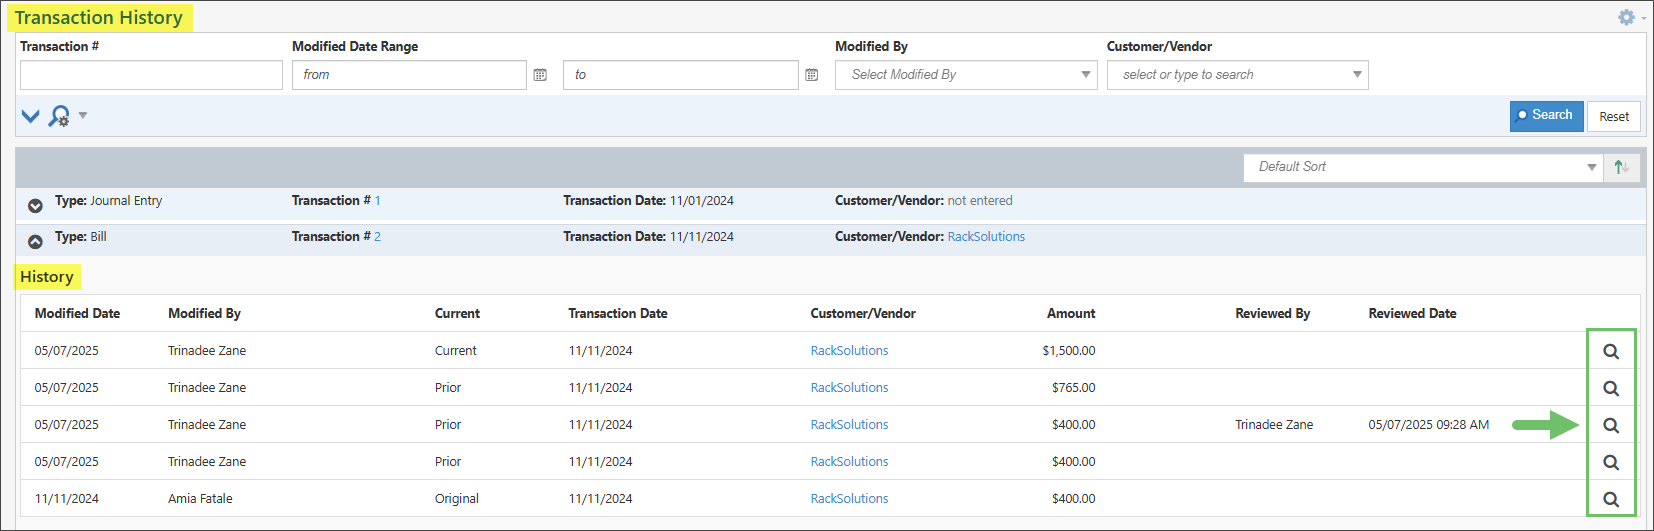
Below is a screenshot illustrating how the Transaction History Audit Trail appears and a description of what can be accomplished there.
- Type: Displays the type of Transaction that is included in the report’s results.
- Transaction #: Lists the Transaction number that is associated with the Transaction. Clicking on the number listed here will open the Transaction to access additional information.
- Transaction Date: Shows the date that is listed on the Transaction.
- Customer/Vendor: Depicts the Customer or Vendor that is listed on the Transaction. Clicking the Customer or Vendor’s name will open their Customer/Vendor profile for more details about the account.
- Show/Hide History: Expands the information regarding the modifications that have been made to the Transaction in a list view. The expanded view of this option will be detailed more in the next section.
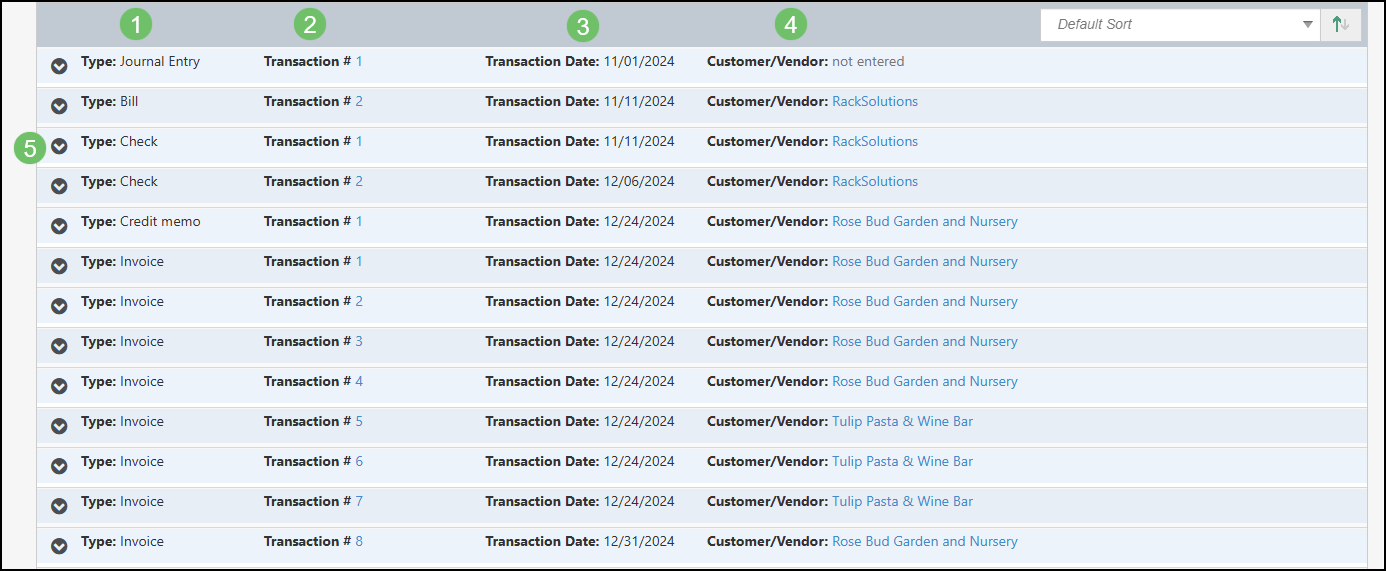
Example of the Information Available in the Transaction History Audit Trail
Show History of Transaction
By clicking the Show History button on a Transaction listed in the Transaction History Audit Trail, a list of the changes that has been made to the Transaction will be listed with additional information.
Below is a screenshot illustrating how the Show History feature on the Transaction History Audit Trail appears and a description of what can be accomplished there.
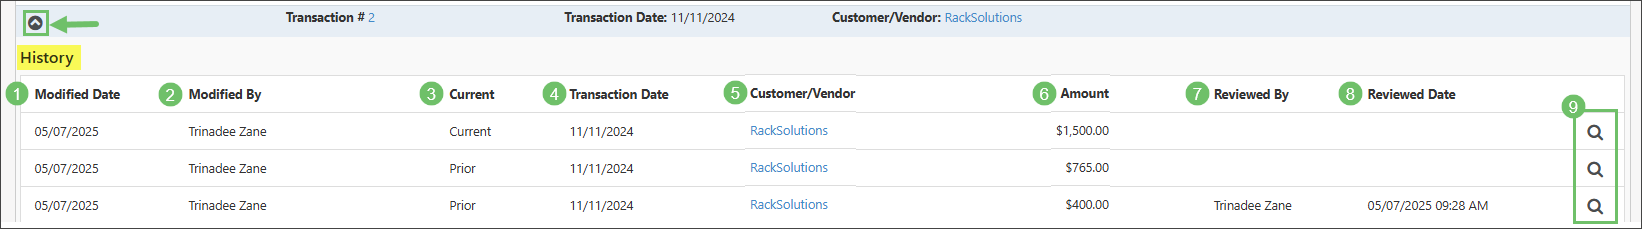
Example of the Show History Feature on the Transaction History Audit Trail
- Modified Date: Lists the date that the modification was made to the Transaction. Each time a Transaction has been modified and saved, a new line item will appear here.
- Modified By: Displays the Employee who has made the change to the Transaction.
- Current: Will indicate the status of the changes that were made to the Transaction. The most up to date version of the Transaction will be shown as Current, while previous versions will be set as Prior and the first edition as Original.
- Transaction Date: Shows the date that was listed on the Transaction for each iteration. If the modification made includes a change to this date, the new date will be listed for the version listed.
- Customer/Vendor: Displays the Customer or Vendor that is associated with the Transaction. If a modification for the Transaction includes a change of Customer or Vendor, the account will be listed with the version of the Transaction accordingly.
- Amount: Lists the total amount that is calculated on the Transaction. As items are removed, added, or adjusted, this amount will update per version in order to reflect the modification.
- Reviewed By: Indicates the Employee who completed the review of the Transaction through the Transaction Review Queue.
- Reviewed Date: Records the date and time the transaction was reviewed.
- View Snapshot: Opens the Transaction’s Snapshot view which will be detailed in the next section.
-
Transaction Snapshot
The Transaction Snapshot view gives a visual representation of the changes that have been made with options to view the current and previous versions of the Transaction.
The Transaction Snapshot page can be accessed by clicking the View Snapshot icon from the Transaction History Audit Trail Report.
Example of the View History Icon on the Transaction History Audit Trail Report
Another way to access this page is by clicking the History icon that is listed in the Actions menu when viewing a Transaction.
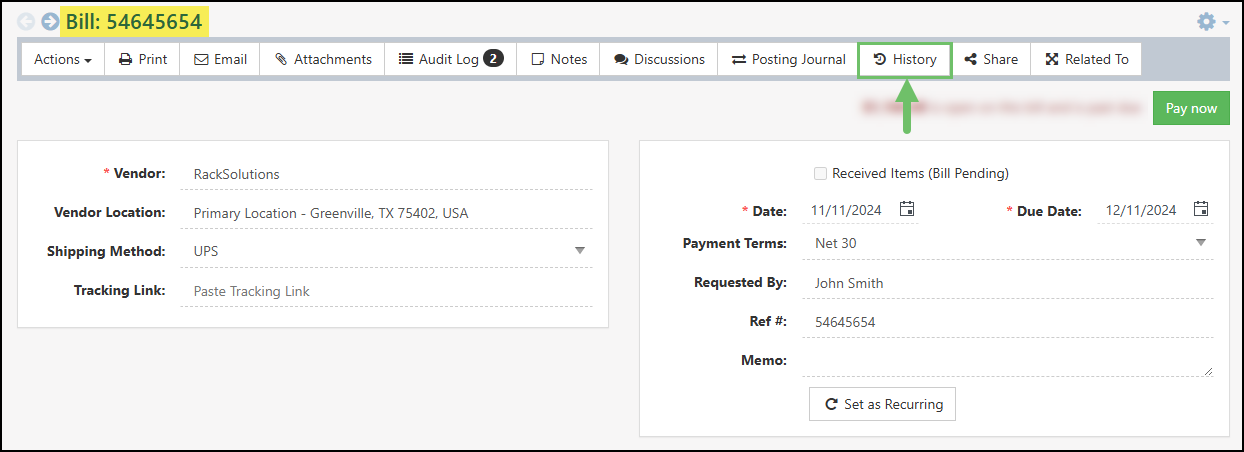
Example of the History Button on a Transaction
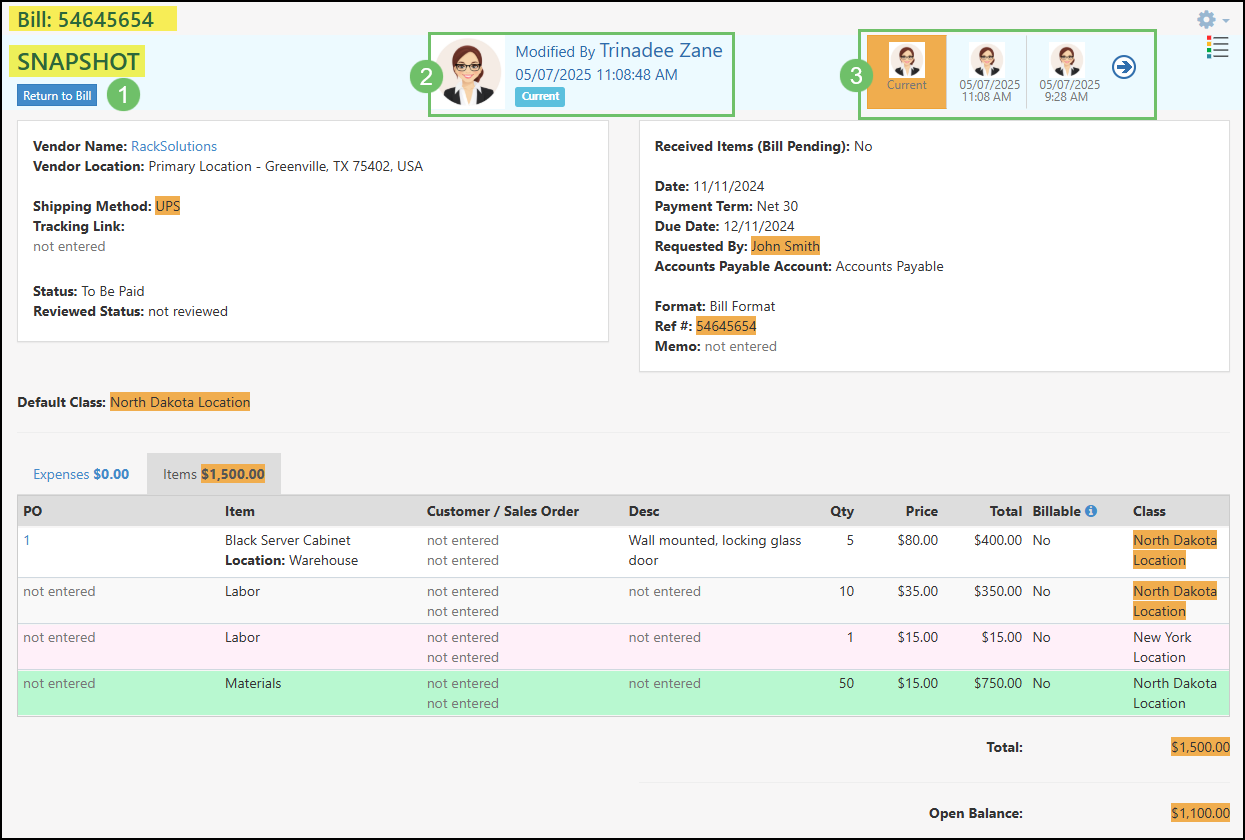
Below is a screenshot illustrating how a Transaction Snapshot page appears and a description of what can be accomplished there.
- Return to Transaction: Will navigate back to the Transaction instead of viewing the Snapshot version.
- Current Version Information: Displays the Employee who made the changes to the version being viewed along with the date and time the modifications were completed.
- Previous Versions: Enables users to review prior versions of a Transaction. This functionality helps identify specific changes, the individuals responsible for those modifications, and the timestamps of when they occurred.
Example of a Transaction Snapshot Page
In the example provided below, a number of changes have been made to the Transaction. These modifications are indicated through the use of highlighting areas on the Transaction in specific colors which will indicate the following:
- Orange: Data that is highlighted in an orange color indicates that the information has been changed from a previous version.
- Green: New items that have been added to a Transaction will be highlighted in a green color.
- Red: Items that have been removed from the Transaction will be highlighted in a red color.

Example of Changes Shown in a Transaction Snapshot
-
Budgets & Forecasts
You can use Budgets and Forecasts to assist in creating a financial plan for your Company. In Striven, we recommend using Budgets to set goals for how much you want to spend and Forecasts to set goals for how much you want to make in a given time period.
Example of a Budget & Forecast
Permissions
The following permissions will need to be configured for the Employee’s User Role if they will be managing or viewing Budgets & Forecasts in Striven:
- “Budgets and Forecasts – Add/Edit”
- “Budgets and Forecasts – View”

Example of Budget & Forecast Permissions
Learn more about managing User Roles and Permissions in Striven by reviewing the User Roles Guide.
Budgets & Forecasts List
To add and manage Budgets or Forecasts navigate to Reports → Financials → Budgets & Forecasts.
Below is a screenshot illustrating how the Budgets & Forecasts list appears and a description of what can be accomplished there.
- Search Filters: Narrows down the results for the Budgets & Forecasts list based on either the Name, Year, Type (Budget or Forecast), or Status.
- Add: Opens the Add Budget/Forecast page in order to create a new Budget or Forecast.
- Budget or Forecast: Lists the existing Budgets or Forecasts. Clicking on the name will open the Budget or Forecast to view.
- Deactivate: Removes the Budget or Forecast from the list of Active results. Update the Status filter to view Inactive Budgets or Forecasts.
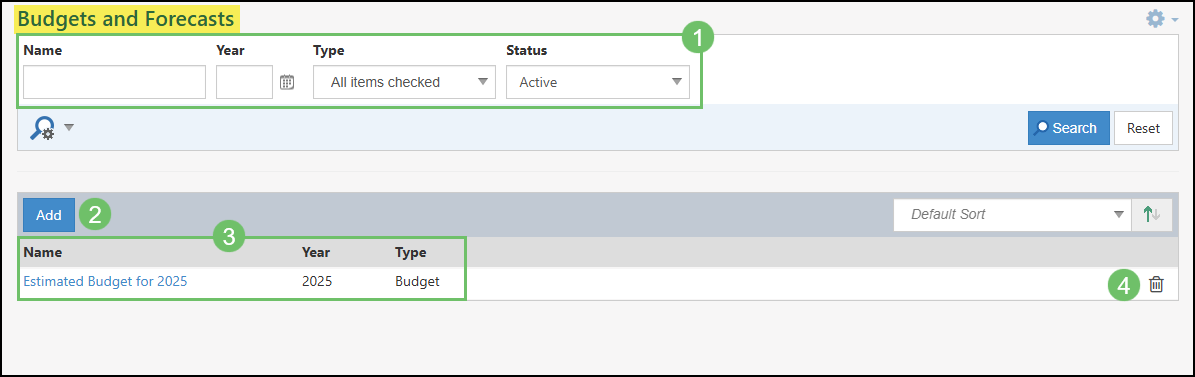
Example of the Budgets and Forecasts List
Adding a Budget & Forecast
Once you have clicked the Add button from the Budgets & Forecasts list, there will be an array of configurations that can be completed in order to customize the Budget or Forecast based on your needs.
Below is a screenshot of the Add Budget/Forecast page and what can be accomplished there.
- Budget/Forecast Name: The name entered here will appear in the Budgets & Forecasts list as well as at the top of the page when you run the report.
- Year: Indicates the year that is being budgeted or forecasted.
- Type: Options include Budget or Forecast. Functionality will be the same when entering in amounts for the Budget or Forecast, but setting which type will be easily identifiable from the Budgets & Forecasts list.
- Include GL Classes: Adds an additional option when viewing a Budget or Forecast to include specific Classes as separate columns.The Class selection will be done after configurations and when viewing the Budget or Forecast.
- Initial Data: Determines the base amounts that will be entered for GL Accounts when viewing the Budget or Forecast. The two options available are as follows:
- Create From Scratch: Creates the Forecast or Budget with no amounts listed per GL Account and will need to be entered manually.
- Copy From Existing Budget/Forecast: Allows for the creation of a Budget or Forecast with data already entered based on a previously created Budget & Forecast. Results for this option will vary depending on the configuration of the Include GL Classes option.
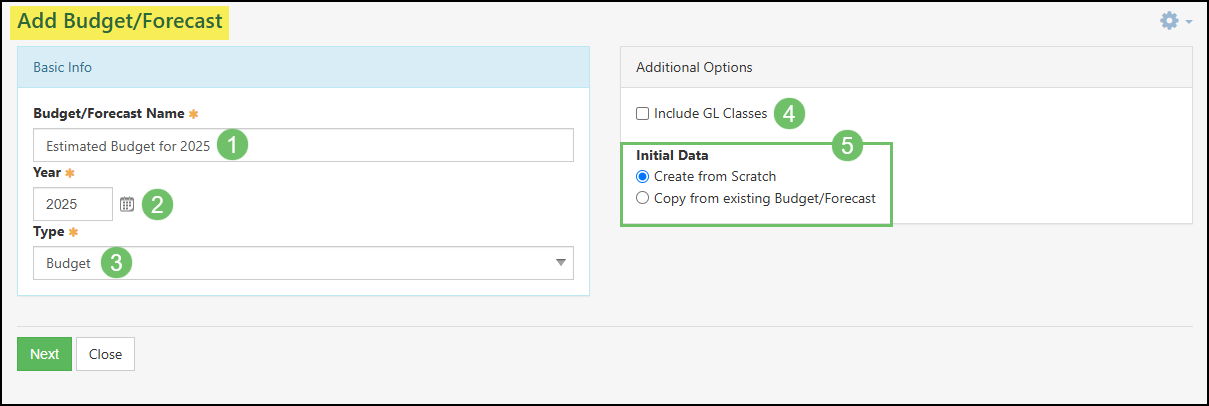
Example of the Add Budget & Forecast Page
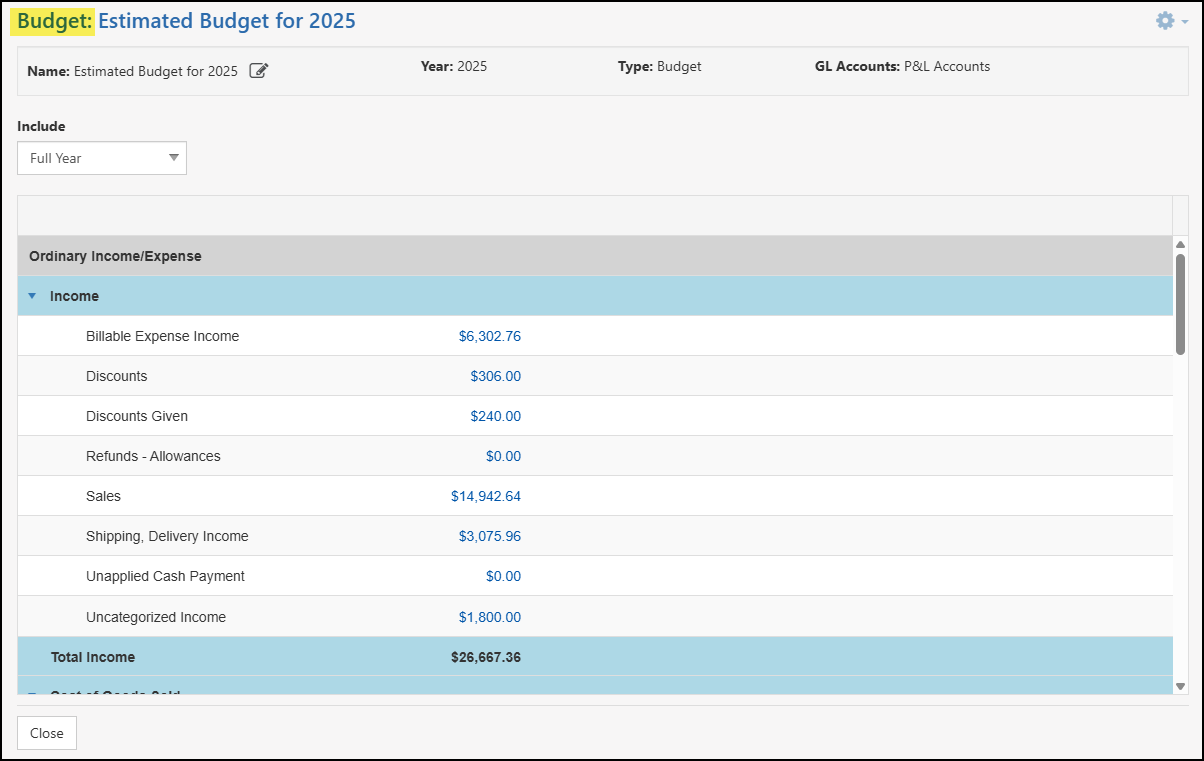
Viewing and Editing a Budget & Forecast
Once you have completed your configurations for a Budget or Forecast, running the report will allow you to enter in amounts for each GL Account. The example below has the following configurations:
- Year: 2025
- Type: Budget
- Include: Full Year
Below is a screenshot of the example Budget and what can be accomplished there.
- Budget/Forecast Information: Lists the information that was previously configured for the Budget or Forecast. Information includes the Name, Year, Type, and GL Accounts Types.
- Include: By default, the Budget or Forecast will be listed with Full Year, changing this field will adjust the amounts listed for each GL Account accordingly. Options also include specific quarters for the year or a specific month for the Budget or Forecast.
- GL Accounts: Lists each GL Account that can have a Budget or Forecast amount entered.
- Budget/Forecast Amounts: Lists the amounts that have been entered for each GL Account. Clicking on the hyperlinked number will allow you to edit the set amounts per GL Account. See below for further details on entering in the Budget or Forecast amounts.
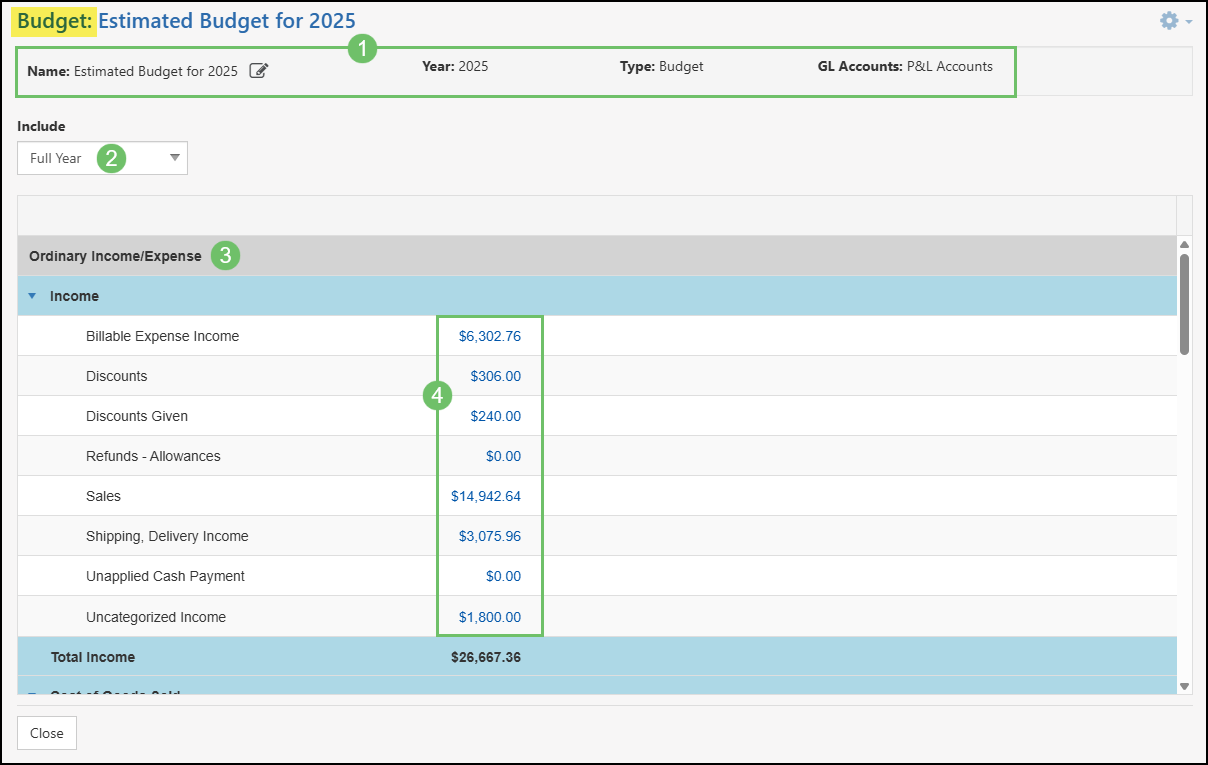
Example of a Budget for 2025
Clicking on an amount listed in a Budget or Forecast will open the Edit GL Account Amounts dialog box. This window will allow you to enter in an amount per month for the selected year.
Below is a screenshot of the Edit GL Account Amounts dialog box and what can be accomplished there.
- Enter Amounts: Each month has a field that can be updated to include the projected Budget or Forecast.
- Copy Down Amounts: To easily copy data down into the below fields, use the down arrow to save time months should have the same amount listed.
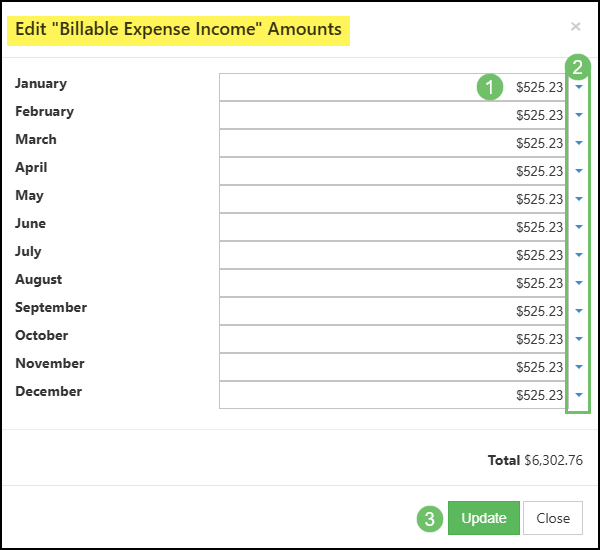
Example of the Edit GL Account Amounts Dialog Box
-
Tax Liability
The Tax Liability Report is a crucial tool for businesses to understand their tax obligations. It provides a comprehensive overview of both taxable and non-taxable sales, broken down by agency. This detailed breakdown allows for easier tracking and management of tax liabilities.
The report offers flexibility by allowing users to view their sales on either an Accrual or Cash Basis. This means that businesses can choose the accounting method that best suits their needs and aligns with their financial reporting practices.
By utilizing the Tax Liability Report, businesses can proactively manage their tax obligations, ensure compliance with tax regulations, and make informed financial decisions.
Permissions
The following permissions will need to be configured for the Employee’s User Role if they will be utilizing the Tax Liability Report in Striven:
- “Cash Flow Report – Export”
- “Cash Flow Report – View”

Example of the Tax Liability Report Related Permissions
Learn more about managing User Roles and Permissions in Striven by reviewing the User Roles Guide.
Viewing the Tax Liability Report
Access the Tax Liability Report by navigating to Reports → Financials → Tax
Below is a screenshot of how the Tax Liability Report appears and descriptions of what can be accomplished there:
- Search: The Search icon allows you to filter the report with the following filters:
- Date Period: By default, this filter is set for Last Month.
- Date Range
- Tax Agency
- Tax Code
- Class
- Report Basis: Allows you to choose a reporting basis of Accrual or Cash for this report. The default reporting basis of Accrual or Cash is based on the Tax Settings configured for your Company
- Filters: Displays which filters are applied to the displayed report. These filters can be configured by clicking on the Search icon, or by selecting the Filter icon. This section also displays the number of results matching your filters that are displayed on the report.
- Collapse All: Using the Collapse All option allows you to collapse every group displayed on the report. Once collapsed, the option will change to an Expand All button, which can be selected to expand the groups once more.
- Export Options: Selecting the Export option will open a drop-down list allowing you to choose your preferred file type. The export options for the Tax Liability Report are currently Excel and PDF.
- Report Details: The Tax Liability Report will have each Agency separated out into a group, which by default displays expanded to list the Tax Codes and their values.
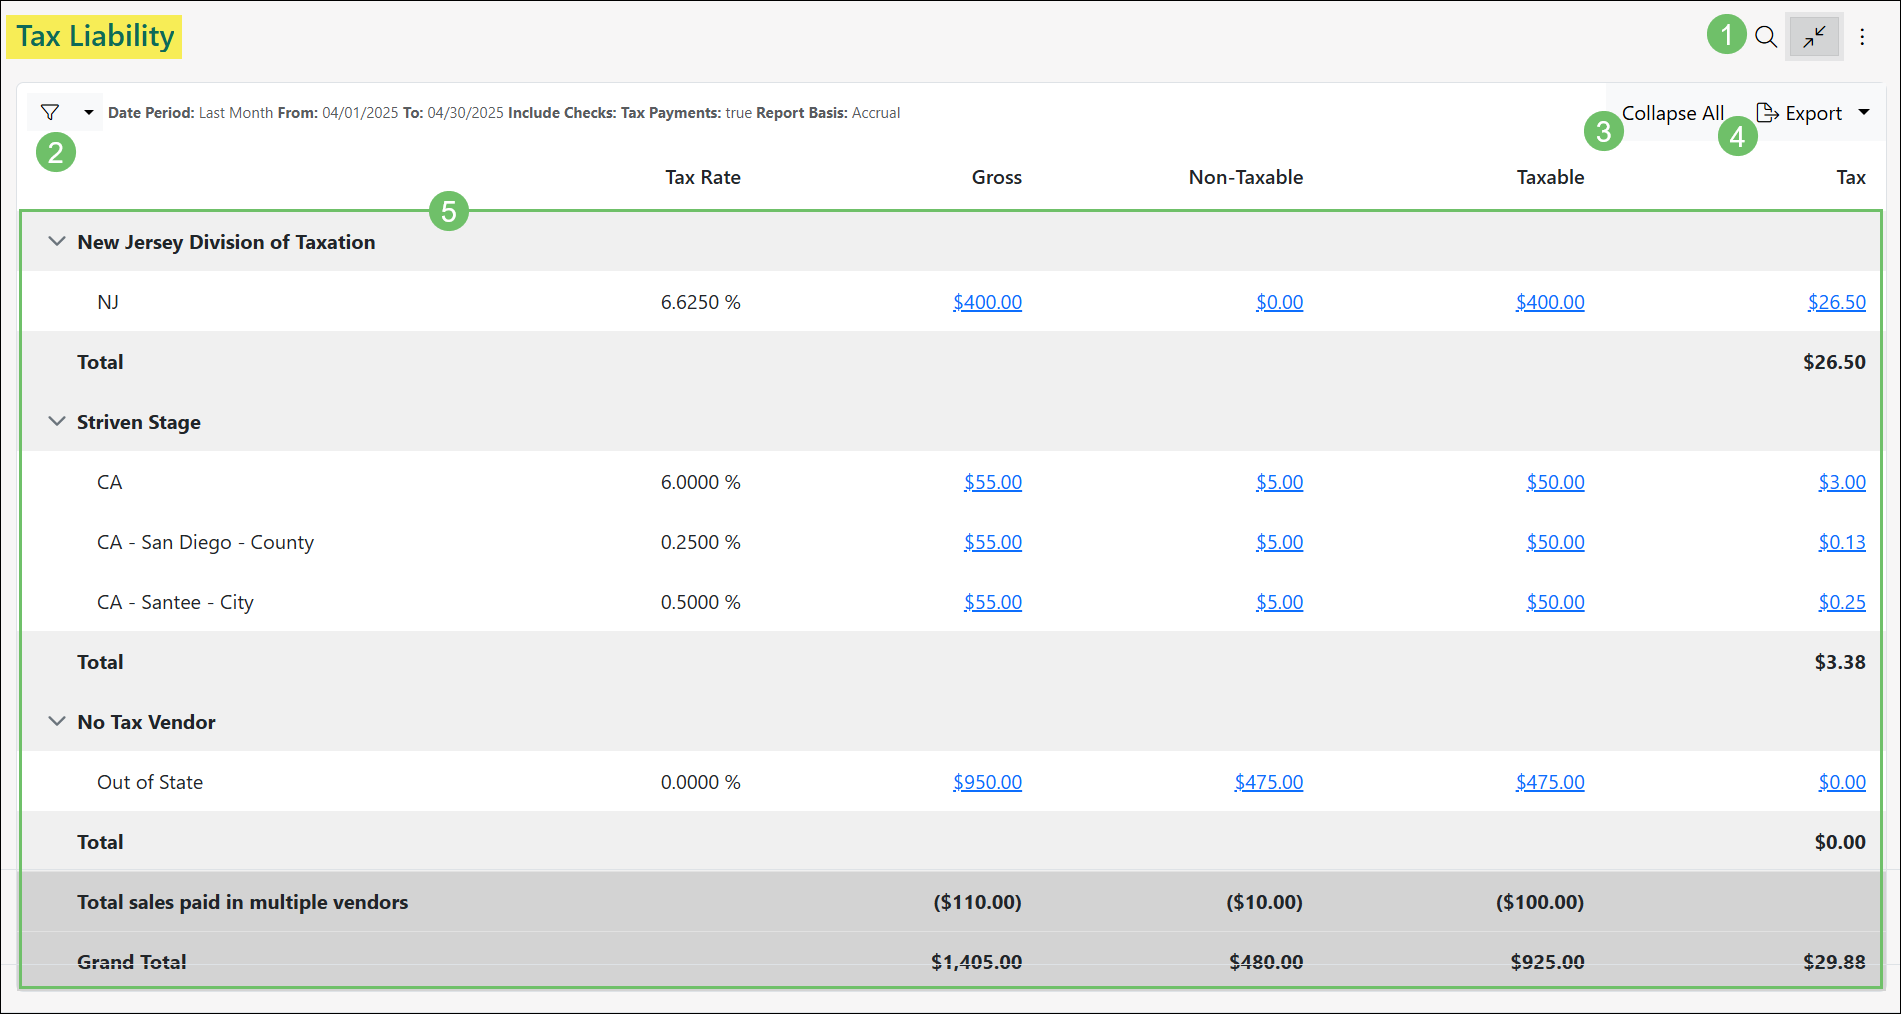
Example of the Sales Tax Liability Report
For each Agency, the report will display the gross amount, non-taxable, taxable, and total tax. By clicking on an amount within the report for one of these columns, you will be brought to a detail report to see what transactions make up the sum total. These detail reports can be exported to Excel and PDF.
If Tax Adjustments have been recorded, the adjustments will be displayed separately within the report, and will only display a value within the Tax column.
It is important to note that if a Tax percentage for a Tax Group changes over time, the value for each percentage will be displayed separately on the report.
-
Transaction Review Queue
The Transaction Review Queue is a great way to make sure there is a checks and balance in place for when all types of Transactions are created. Once a Transaction has been reviewed from the Transaction Review Queue, an indication of such will be displayed both on the Transactions list and the Transaction Snapshot page. This review process is a useful way to keep on top of Transactions created by certain employees or specific types of Transactions.
Example of the Transaction Review Queue
Permissions
There are fifteen (15) User Role permissions related to the Transaction Review Queue.
- “Bill Credits – Review”
- “Bills – Review”
- “Checks – Review”
- “Credit Card Charges – Review”
- “Credit Memos – Review”
- “Deposits – Review”
- “Fund Transfers – Review”
- “Inventory Adjustments – Review”
- “Inventory Transfers – Review”
- “Invoices – Review”
- “Item Builds – Review”
- “Journal Entries – Review”
- “Payments – Review”
- “Sales Receipts – Review”
- “Transaction Review Queue”
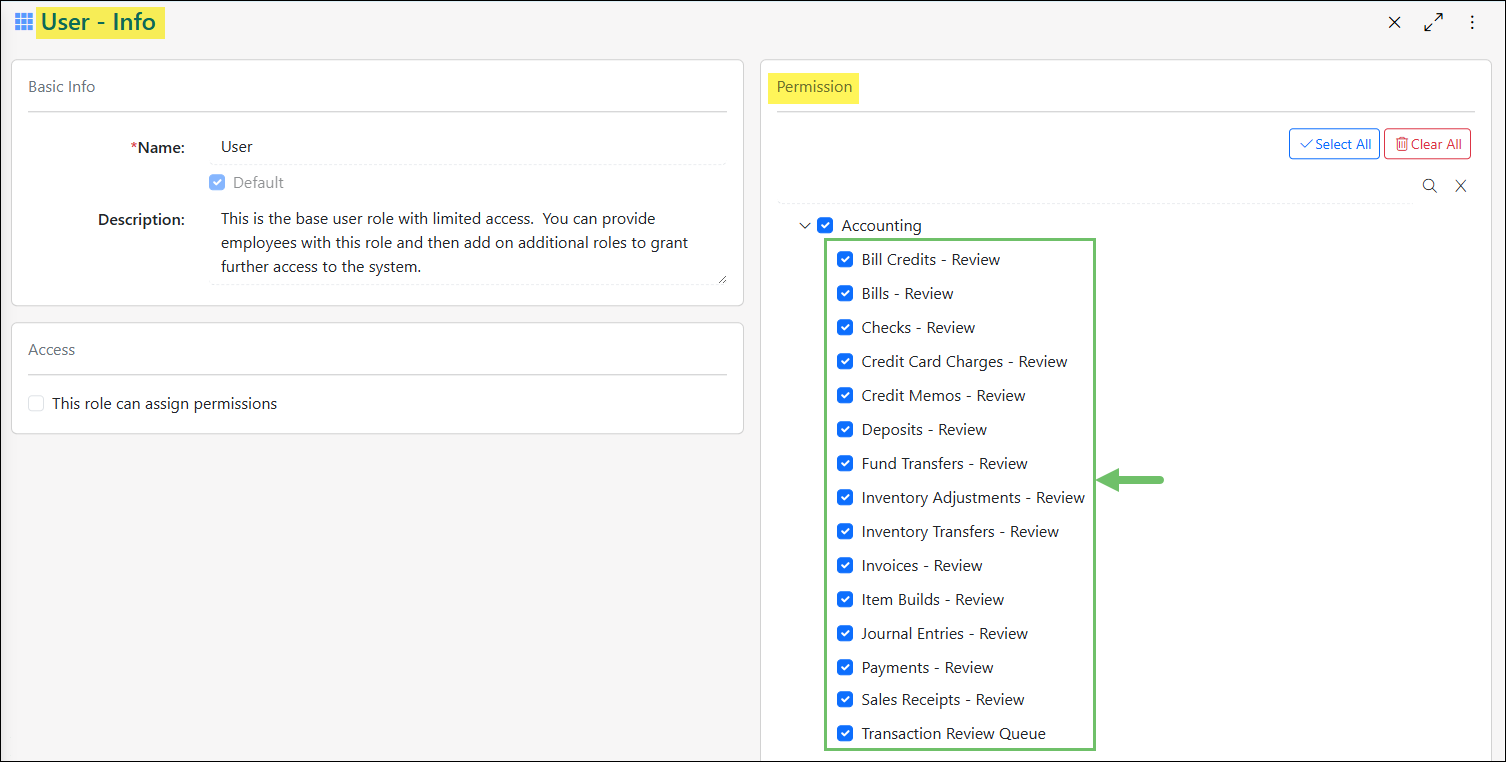
Example of Transaction Review Queue Related Permissions
Learn more about managing User Roles and Permissions in Striven by reviewing the User Roles Guide.
-
Viewing the Transaction Review Queue
Once Transactions are created, they will automatically be added to the Transaction Review Queue and will remain until they have been marked as reviewed. Based on the permissions that a user has will determine their access to the queue and which types of Transactions they are able to mark as reviewed. This gives the flexibility, for example, to allow one user to review Accounts Receivable Transactions and another to be in charge of reviewing Accounts Payable Transactions.
To begin using the Transaction Review Queue, navigate to Accounting → Queues → Transaction Review.
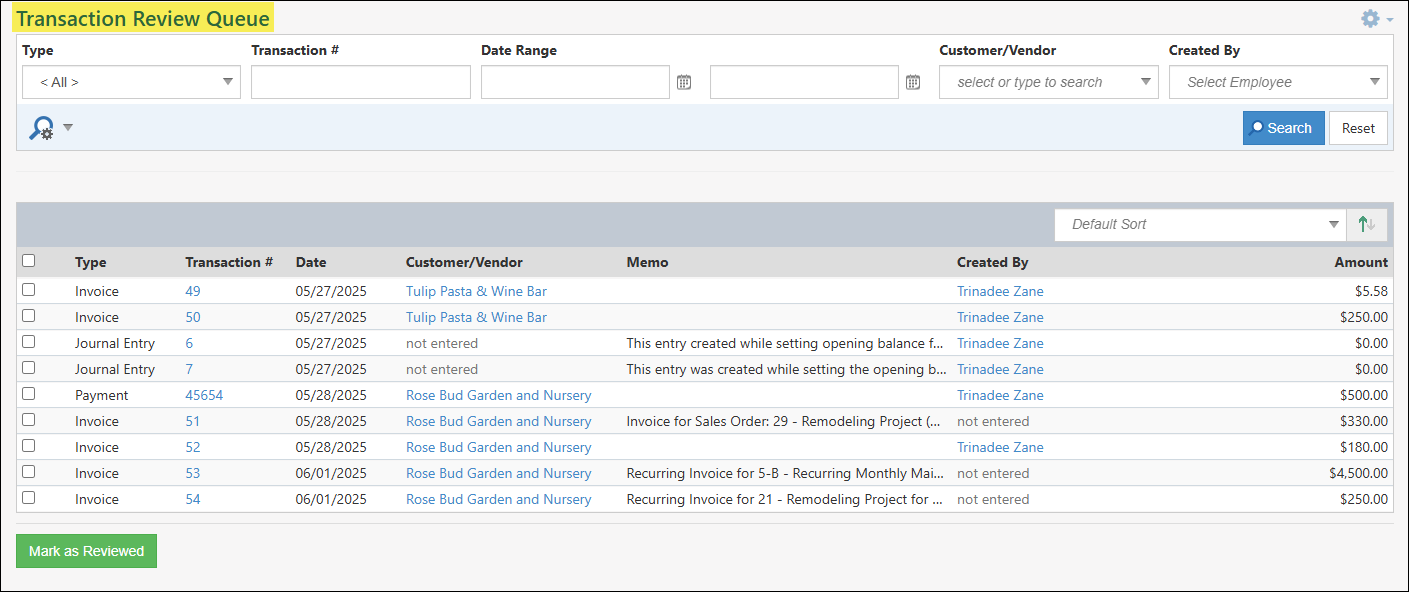
Below is a screenshot illustrating how the Transaction Review Queue appears and a description of what can be accomplished there.
- Search Filters: There are an array of search filters available to narrow down which Transactions you would like to mark as reviewed.
- Type: Narrows down search results based on the type of Transaction.
- Transaction #: Displays results based on the specific Transaction number.
- Date Range: Updates the queue to only display Transactions within a specific start and end date.
- Customer/Vendor: Lists results based on a singular specific Customer or Vendor selected.
- Created By: Narrows down search results based on who created the Transaction.
- Checkboxes: Using the checkbox option will determine which Transactions will be set as reviewed once the Mark as Reviewed button has been clicked at the bottom of the queue. The top checkbox can be used to check off all the Transactions listed on the page.
- Type: Displays the type of Transaction for the Transaction that still needs to be set as reviewed.
- Transaction #: A hyperlink of the Transaction number. Clicking on the hyperlinked number listed will open the Transaction in a new tab for further review.
- Date: Lists the date that is set on the Transaction.
- Customer/Vendor: A hyperlink of the Customer or Vendors name. Clicking on the hyperlink listed in this column will open the Customer or Vendor profile for further information. If no name is listed in this column, then there is not a specific Customer or Vendor related to the Transaction such as for Deposits, Fund Transfers, Inventory Adjustments, Inventory Transfers, Item Builds, and Journal Entries.
- Memo: Shows the memo that is on the Transaction. If no memo is listed, then the Memo field on the Transaction is left blank.
- Created By: A hyperlink of the Employee’s name who created the Transaction. Clicking on the Employee’s name will open their Employee Information card.
- Amount: Lists the amount that is totaled on the Transaction.
- Mark as Reviewed: Will change the status of the selected Transactions as reviewed.
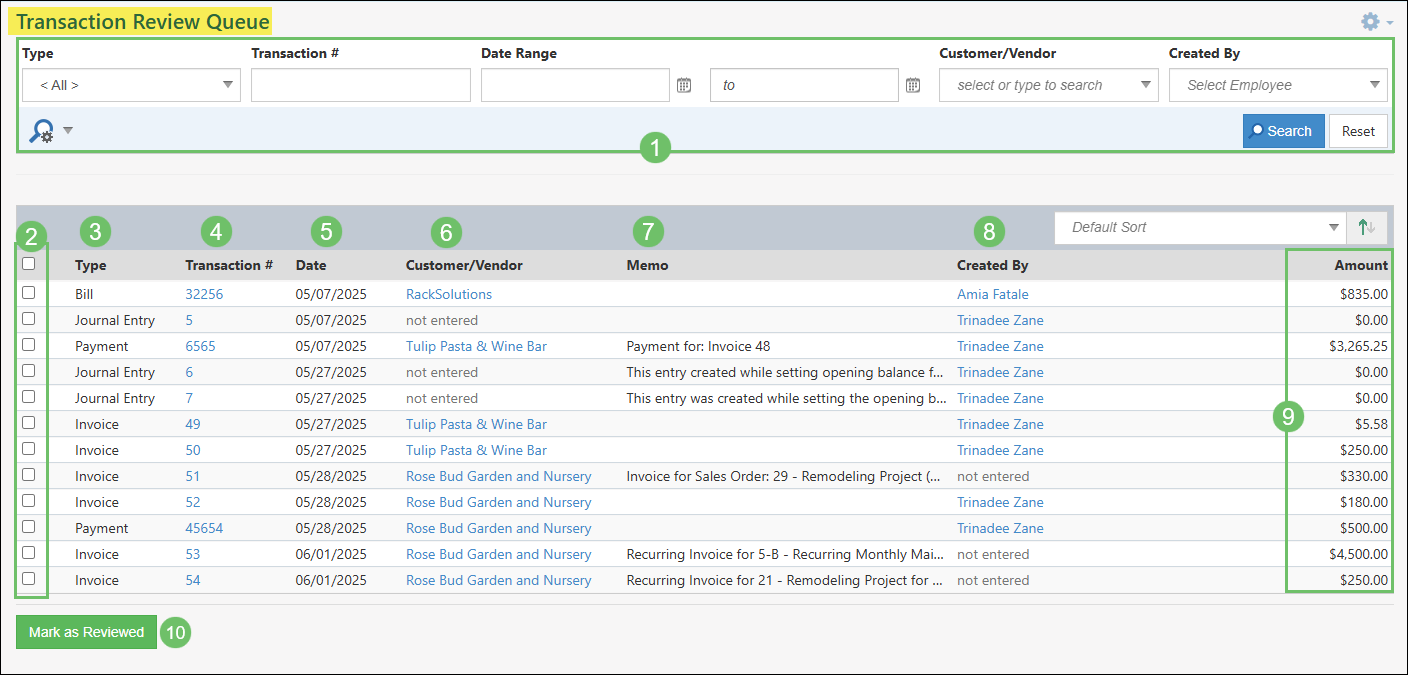
Example of Actions and Information Available on the Transaction Review Queue
- Search Filters: There are an array of search filters available to narrow down which Transactions you would like to mark as reviewed.
-
Reviewed Transactions
Once a Transaction has been marked as reviewed, there are two places where it is indicated that the Transaction has been reviewed from the Transaction Review Queue. The first place is from the Transactions list and the second being in the Transaction Snapshot page. Once reviewed, the Transaction will no longer appear within the Transaction Review Queue.
Transactions List
When viewing the Transactions list, any Transaction that has been marked as reviewed will have an eye icon listed within the list results. This icon indicates that the Transaction has been marked as reviewed from the Transaction Review Queue.
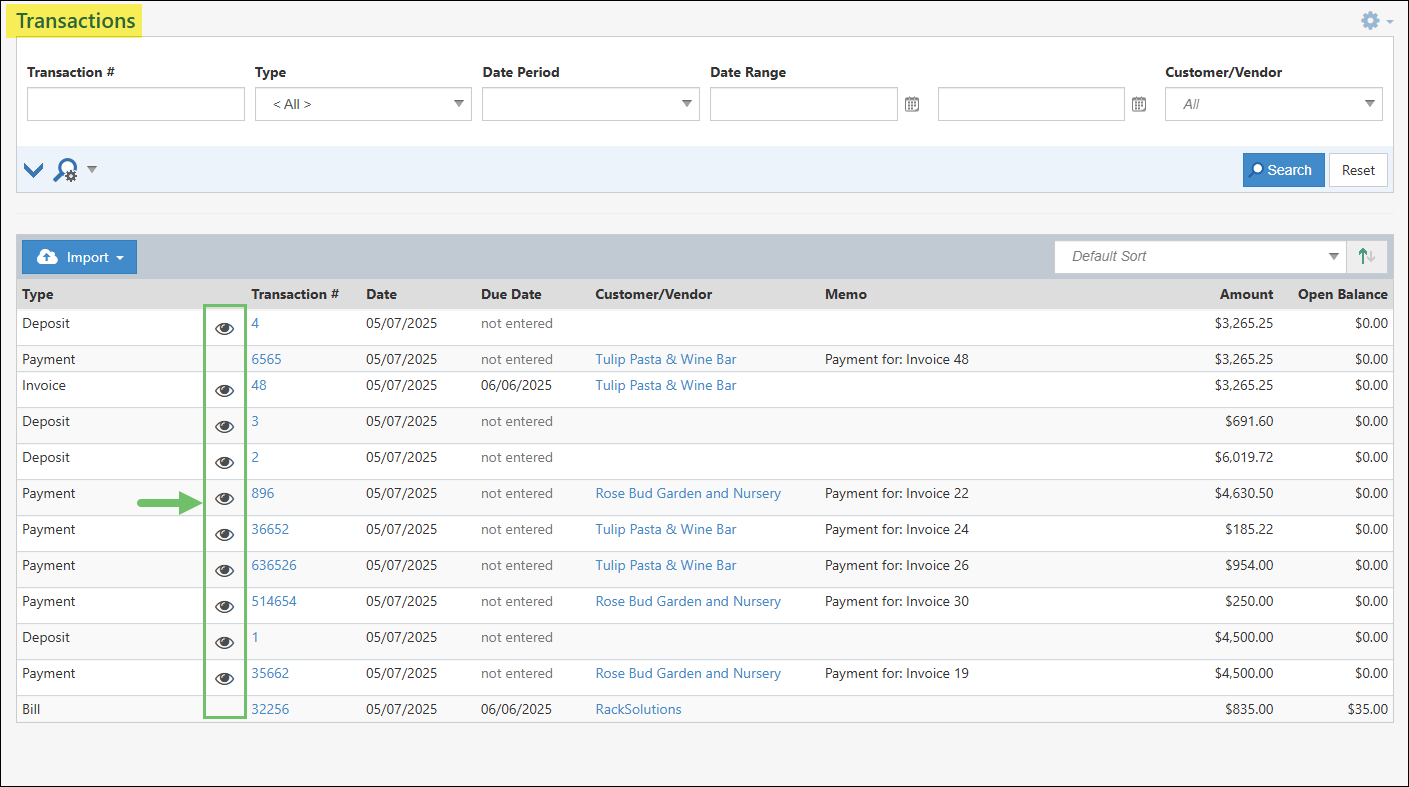
Example of Reviewed Transactions from the Transactions List
Transaction Snapshot
A Transaction Snapshot is a historical view of a Transaction which highlights each edit or change that has occurred during the Transaction’s lifespan. When viewing a Transaction, clicking the History icon will open the Transaction Snapshot page for further review.
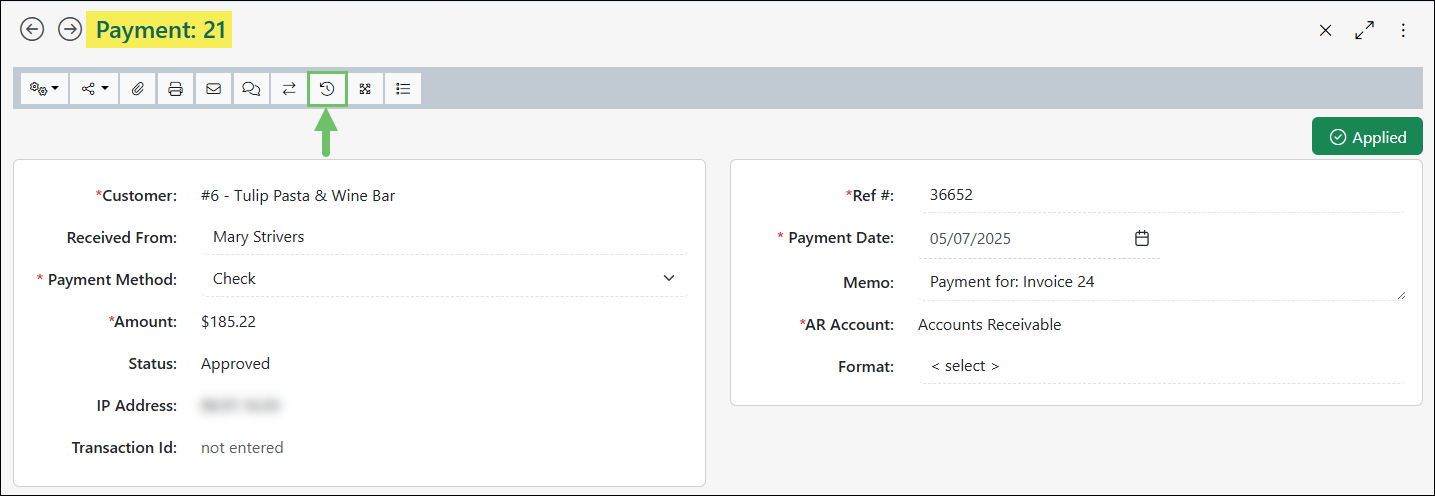
Example of the History Icon on a Transaction
When viewing the Transaction Snapshot page, a Reviewed Status field will appear which will indicate the Transaction has been marked as reviewed from the Transaction Review Queue. This information will include who the review was completed by along with the date that the Transaction was set as reviewed. If this field does not have any information listed, then this indicates the Transaction has not been reviewed and will still be listed in the Transaction Review Queue.
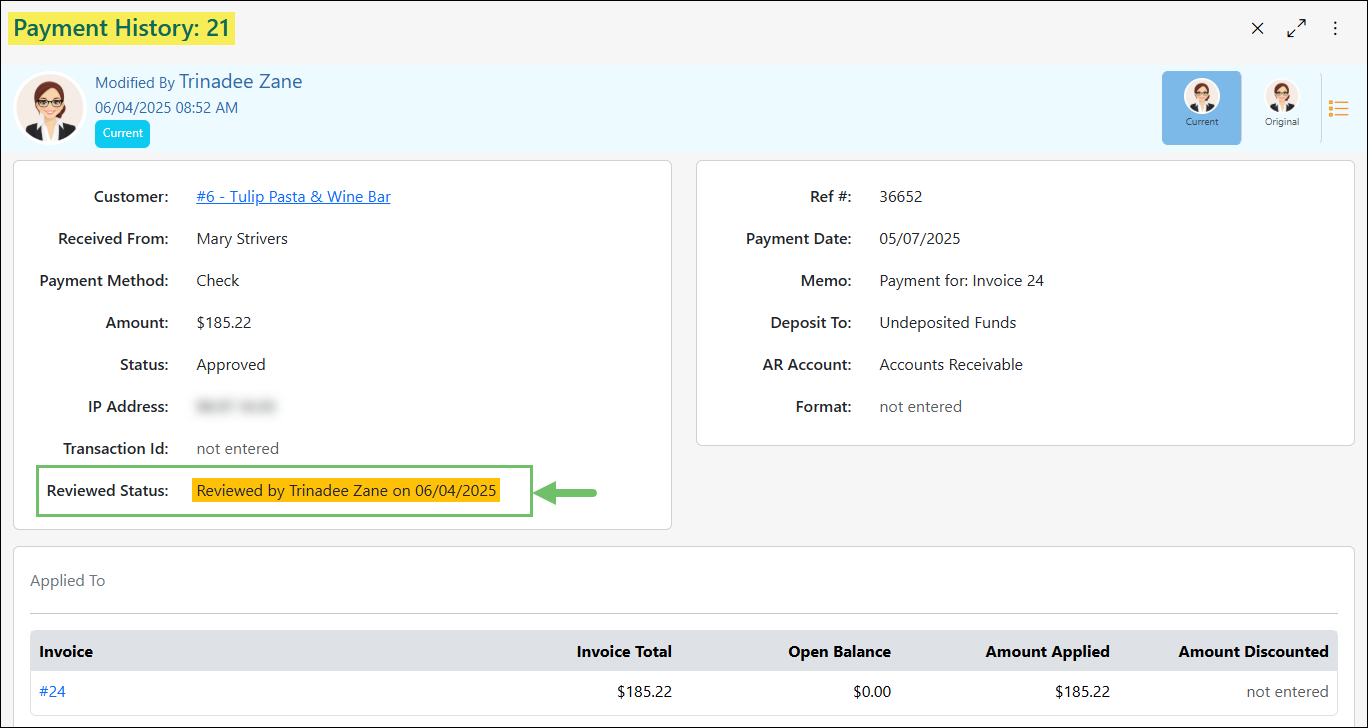
Example of a Transaction Snapshot with the Reviewed Status
-
Recap
With this Financial Reporting Guide, we’ve discovered ways to report on an Accrual or Cash basis of accounting to ensure the best user experience when accounting in Striven. We reviewed a number of built-in financial report options to explore the many ways you can track your finances with Striven.
Have a Question?
Ask the Striven Community
User-sourced how-to’s, feedback, and more!
FAQs
-
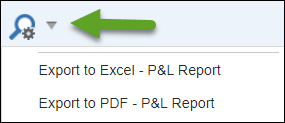
I want to export my P&L Report and print it; how do I do that?
Once you’ve configured your filters and have your P&L Report generated, you can click on the gray down arrow next to the magnifying glass icon below the search filters. This will display a drop-down menu with options to export the report to Excel or as a PDF, which you can then print as you normally would for those types of files. There is also an export option for the P&L by Class Report, though only for Excel.